In analyzing the data from HMDA and the larger flat files from the 2014 LAR data, I found the largest discrepancy in rejection rates in the populations of people who identified themselves as black or white. The black populations showed a 15 percent rejection rate based on the HMDA data and a 22 percent rejection rate from the LAR flat files. The white population had a 13 percent rejection rate based on the HMDA data and a 20 percent rejection rate based on the flat files. Excel pivot tables can show that this discrepancy is due to home refinancing loans, which are not included in the HMDA data.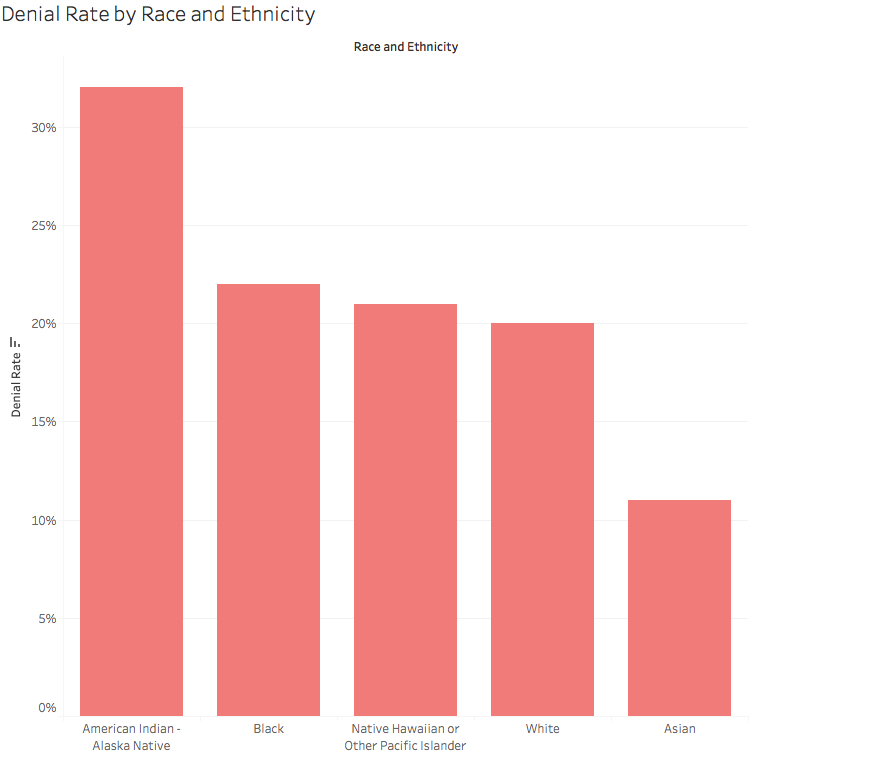
Data Journalism Backup Site
Here is my optional tagline
I was looking for more detail on how the refinancing loans changed the overall totals on the rejection rates. The point of the assignment was to dig into the numbers and show exactly what was in the broader universe of LAR data that accounted for the change. You describe the overall trend but not the details. You mention it here but don’t provide the details: “Excel pivot tables can show that this discrepancy is due to home refinancing loans, which are not included in the HMDA data.”