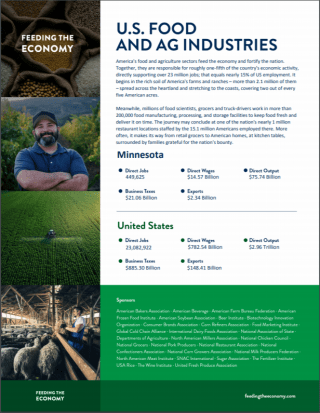
Minnesota
State Quick Facts
Population
5,737,915
Total State GDP
$448,032,400,000
State Land Area (Acres)
50,961,280
Land in Forest (Acres)
17,659,033
Land in Forest
35%
Land in Farms (Acres)
25,400,000
Land in Farms
50%
Number of Farms
65,300
Average Farm Size (acres)
389
Farm Real Estate Value (per acre)
$6,600
Agricultural Cash Receipts
$26,018,792,000
Cash Receipts from Crops
$15,828,823,000
Cash Receipts from Animals
$10,189,968,000
Top Ag. Commodities
Corn
$8,324,770,000
Soybeans
$5,320,423,000
Hogs
$3,723,737,000
Dairy Products, Milk
$2,691,880,000
Cattle and Calves
$2,133,248,000
Top Ag. Exports
Soybeans
$2,854,700,330
Corn
$1,689,035,076
Feeds and Other Feed Grains
$1,051,452,519
Pork
$907,003,332
Other Plant Products
$633,965,276
Alabama | Alaska | Arizona | Arkansas | California | Colorado | Connecticut | Delaware | Florida | Georgia | Hawaii | Idaho | Illinois | Indiana | Iowa | Kansas | Kentucky | Louisiana | Maine | Maryland | Massachusetts | Michigan | Minnesota | Mississippi | Missouri | Montana | Nebraska | Nevada | New Hampshire | New Jersey | New Mexico | New York | North Carolina | North Dakota | Ohio | Oklahoma | Oregon | Pennsylvania | Rhode Island | South Carolina | South Dakota | Tennessee | Texas | Utah | Vermont | Virginia | Washington | West Virginia | Wisconsin | Wyoming
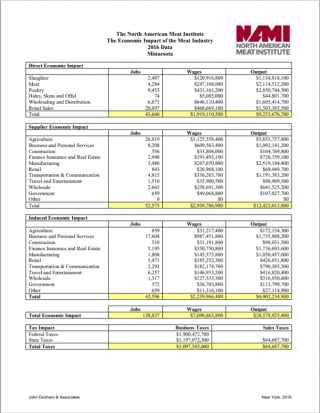
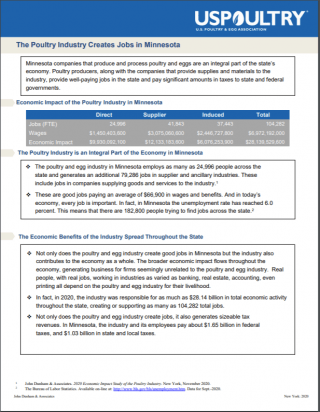
Minnesota Economic Contribution and Impact Research
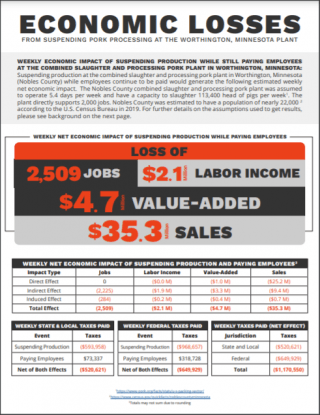
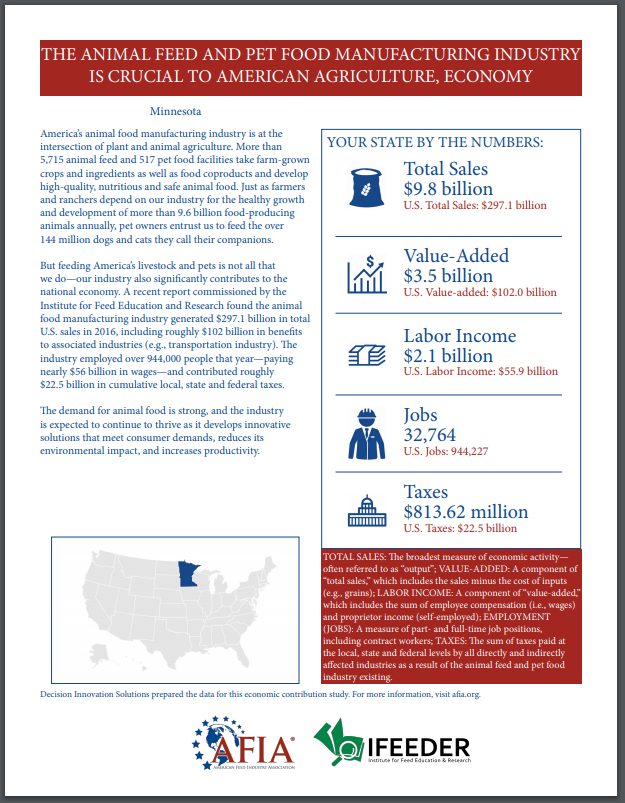
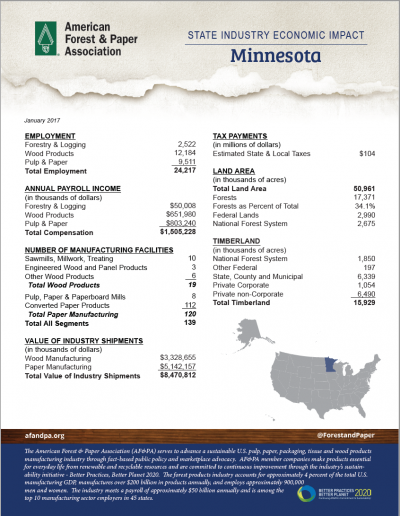
In 2022, Minnesota generated around $26.0 billion in agricultural cash receipts with the highest valued commodities being corn, soybeans, and hogs. That same year, the value of Minnesota’s agricultural production and processing industries represented 5.0 percent of total state GDP. Some of the dollars generated by these industries end up being re-spent within the local economy, bringing additional value to the state through “multiplier effects.” Economic impact and contribution studies measure these effects, which can be broken down into direct, indirect, and induced economic effects.
Websites, reports, fact sheets, and articles related to the economic impacts and contributions of Minnesota’s food, fiber, and forest industries can be found below.
Websites:
Information related to Minnesota’s food, fiber, and forest industries can be found by visiting the following website(s):
Contribution and Impact Research Documents:
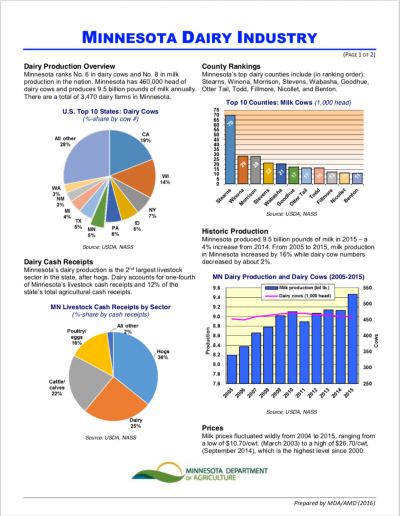
The following are current and historical studies, fact sheets, and articles related to Minnesota’s food, fiber, and forest industries. These can be viewed and/or downloaded by clicking the images or links below:
*At present, there is no universally agreed upon standard methodology for producing economic impact or economic contribution reports. Please exercise caution when viewing and comparing reports as each may vary significantly in terms of source data and analysis and reporting methodology.