Data
NWA School Landscape Analysis
OEP is pleased to share new research about the school landscape in Northwest Arkansas. This report, developed in partnership with TNTP and the Walton Family Foundation examines school quality in NWA regionally, and compares the quality of area schools to the nation and the state. The report al provides district scorecards that examine differences in student outcomes both between schools as well as within schools.
The report finds that NWA schools compare favorably to similar schools nationwide, and perform better than average schools in the state. Among schools in NWA there are significant variations in student outcomes between schools. There are also pronounced differences in student outcomes within the same school between students from lower-income families and their peers.
The main student outcomes included in the report are academic achievement and academic growth, which we describe briefly below.
- Achievement reflects how well students perform on state tests measuring grade-level skills in English language arts and mathematics. Schools serving more advantaged students typically receive “good” achievement scores because a high percentage of their students passed, while schools serving a larger percentage of students who lived in poverty, participated in special education, or were learning English often receive lower scores because a higher percentage of their students were unable to pass the test.
- Growth is a measure of how much students’ scores on these assessments improve over time. Using growth as a measure of school success levels the playing field because all students are evaluated by the extent to which they grow from their own starting point; thus, students facing socioeconomic barriers to achievement have the same opportunity for growth as do their peers from advantaged backgrounds. All students can grow their understanding, and we should expect all schools to foster student growth, regardless of family income, first language, or learning needs.
The first part of the report provides a regional perspective and information about the data used for the analyses. When compared to the rest of the nation, NWA schools rank at the 63rd percentile for achievement, the 56th percentile for annual academic growth, and the 46th percentile for academic growth over time.
- NWA schools have higher achievement than the state overall
- NWA schools increase student learning at rates similar to that schools across the country
- Access to high-quality schools varies by district.
- Students from lower-income families and students of color typically attended lower quality schools than their peers in NWA, but higher-quality schools than similar students across the country.
- There are pronounced differences in student achievement and academic growth within the same school between students from lower-income families and their peers. The majority of NWA schools, however, provided economically disadvantaged students with experiences that were better than average for all students statewide.
Here at OEP we are especially interested in the part of the report that provides information about students’ academic achievement and academic growth by district and school. The figure below uses data from the report to present percentiles for academic growth and achievement for the 19 districts and public charter systems in NWA. We have ordered districts by the percentage of students receiving free or reduced-price lunch (%FRL), which is a proxy measure for the percentage of students enrolled in the district who face economic disadvantages outside of school.
Figure 1. Median statewide percentiles for growth and achievement, by district, 2022. 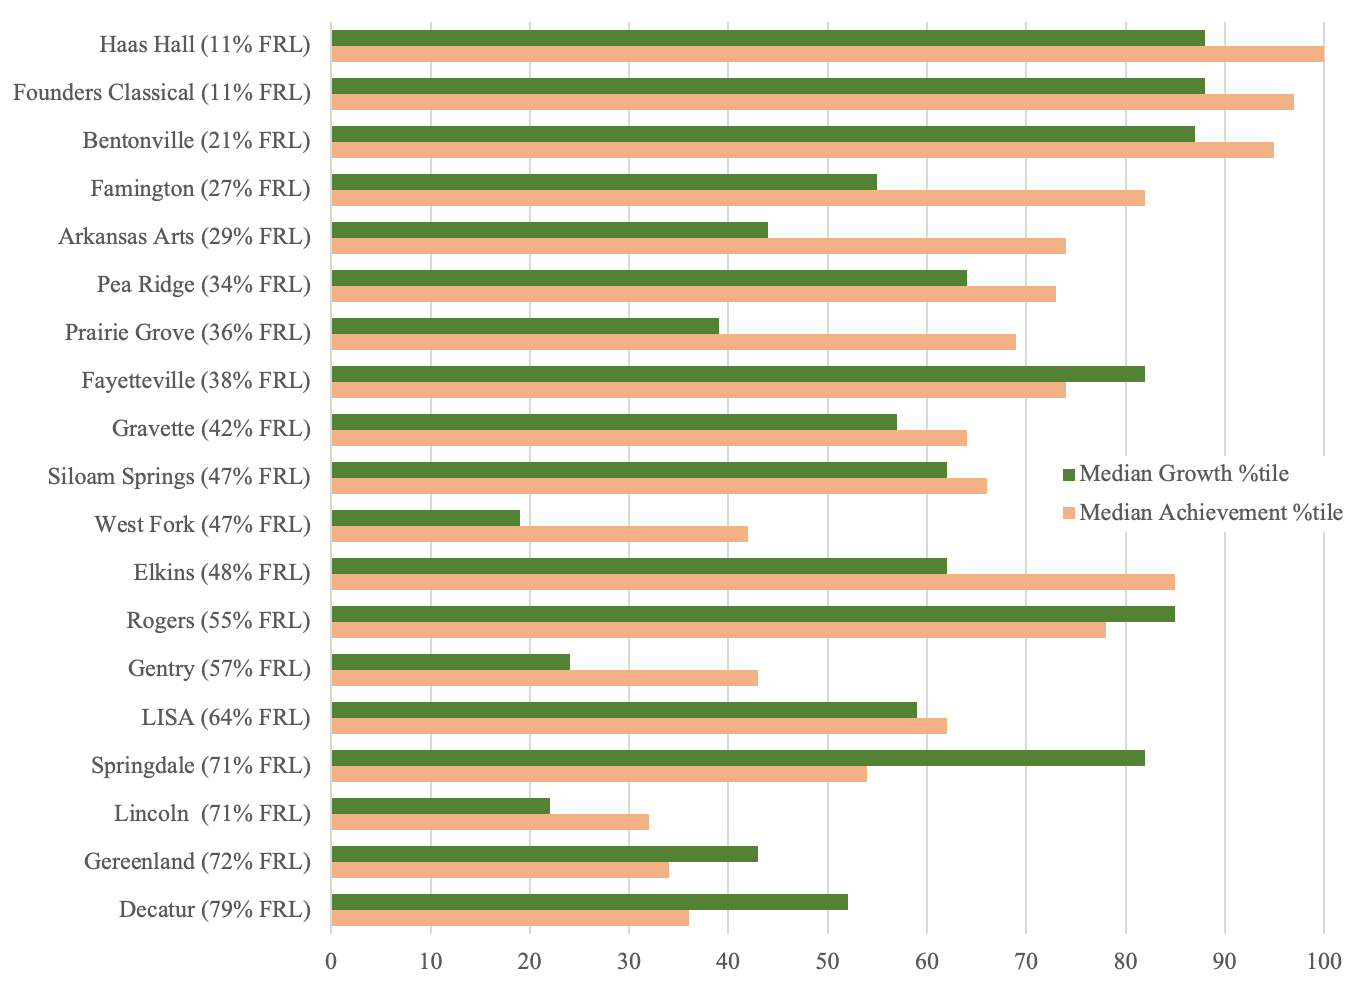
We believe that high growth is the best reflection of a quality school. We prefer to focus on growth because it is essentially unrelated to student experiences outside of school. This is in contrast to achievement, because the percentage of students who pass state assessments is generally strongly related to the percentage of students experiencing poverty at home (aka % FRL). Academic growth reflects the learning that is going on in classrooms, which is why we give OEP awards to schools where students are demonstrating the highest growth.
In the figure above, we can see that Haas Hall, Founders Classical, Bentonville School District, and Fayetteville School District are in the highest percentiles of student academic growth (indicated by the green bar) AND student achievement (indicated by the orange bar). Rogers School District and Springdale School District serve a much higher percentage of students experiencing economic disadvantages than the districts listed above, but demonstrate similarly high levels of student academic growth! Although we highlighted these six districts, any district above the 50th %tile for growth is improving students’ learning more than the average school in the state. As students progress through a school system, higher rates of academic growth will lead to increased achievement.
For each NWA district, the report includes two analyses that drill down to the school level and illustrate each school’s performance for economically disadvantaged students and non-economically disadvantaged students. This matters to us here at OEP because it shows the differences in learning outcomes and opportunities between the “haves” and “have nots” within the same school. Below we highlight schools that are demonstrating high achievement and growth for the students who face economic disadvantages.
Which schools in NWA had the highest achievement for all students?
As we noted earlier, achievement is highly correlated to the population of students served at the school. NWA has many schools where non-economically disadvantaged students demonstrate high achievement, but only ten schools where economically disadvantaged students achieve at or above the level of their more advantaged peers in a typical school in Arkansas.
The schools where economically disadvantaged students demonstrate very high achievement are:
- Bentonville School District’s Willowbrook Elementary, Bright Field Middle, and Washington Junior High
- Founder’s Classical Academies in Bentonville
- Haas Hall Academy, Haas Hall Bentonville, and Haas Hall at the Lane
- Rogers School District’s Janie Darr Elementary and Eastside Elementary
- Springdale School District’s John Tyson Elementary
Which schools in NWA achieved the most growth for all students?
The report identifies 32 schools throughout the region where both economically disadvantaged students and non-economically disadvantaged students are demonstrating academic growth in the top 25% of schools statewide. These high-growth schools are distributed throughout the region and are as follows:
- Bentonville School District’s Washington Junior High, Bright Field Middle, Mary Mae Jones Elementary, Central Park at Morning Star, Lincoln Junior High, Cooper Elementary, R.E. Baker Elementary, Ardis Ann Middle, J. William Fulbright Junior High, and Thomas Jefferson Elementary
- Fayetteville School District’s Asbell Elementary and Happy Hollow Elementary
- Rogers School District’s Eastside Elementary, Westside Elementary, Garfield Elementary, Tillery Elementary, Tucker Elementary, and Grimes Elementary
- Springdale School District’s Hunt Elementary, John Tyson Elementary, Bayyari Elementary, George Elementary, Hellstern Middle, Turnbow Elementary, Walker Elementary, Linda Childers Knapp Elementary, Helen Tyson Middle, and Harp Elementary
- Decatur High School
- Elkins Middle School
- Gravette Middle
- Pea Ridge Middle
In general NWA has many high-quality schools, and there are some systems that are generating greater learning growth among students than others. Here at OEP we want all students to experience high levels of learning growth. In the case of schools where students are less likely to be experiencing growth, the school community should work together to identify the root cause and work to make adjustments that will benefit students. OEP will be happy to help!
It is important to note that the achievement and growth scores only represent the performance of students in grades 3-10 on state assessments in English Language Arts and mathematics. We know that teachers and student do LOTS of important things in school that aren’t measured by this report, but NWA schools can move towards greater levels of academic growth and proficiency in reading and math.
2022-2023 ACT Aspire Post Appeal Scores
2022-2023 Demographics Data
2021-2022 School Level Expenditures
2020-2021 Grade 11 ACT
2019-2020 ACT/AP Data
2020-2021 ACT Aspire
2020-2021 School Level Expenditures
2019-2020 School Level Expenditures
Contact Us
Phone: 479.575.3773
Fax: 479.575.3196
201 Graduate Education Building
The Office for Education Policy
Arkansas-focused education research for Arkansas’ education stakeholders. Let us answer your questions.
College of Education and Health Professions
University of Arkansas