English language learners (ELs) are a growing student population throughout Arkansas. With the passage of ESSA, the progress of EL students towards proficiency in English has been added to the metrics by which schools and districts are held accountable. With this academic context in mind, we at the Office for Education Policy thought it would be useful to provide a descriptive analysis of the EL population in Arkansas. These analyses, beginning with an overview of the recent enrollment trends in the state, may help policymakers and school leaders better understand this important group of students.
Recent data from the National Center for Education Statistics (NCES) show that ELs comprise about 9.5% of K-12 students in the United States. Some states have a larger share of EL students than others. For example, in fall 2016, only about 1% of West Virginia’s student population were ELs while nearly 16% of students in Nevada were ELs.
We really like this map from USDOE that shows the percentage of ELs by school district across the country.

Additionally, some states are experiencing faster growth in the proportion of EL students than others. For example, the states with the highest growth of EL student population from 2000 to 2014 include Arkansas.
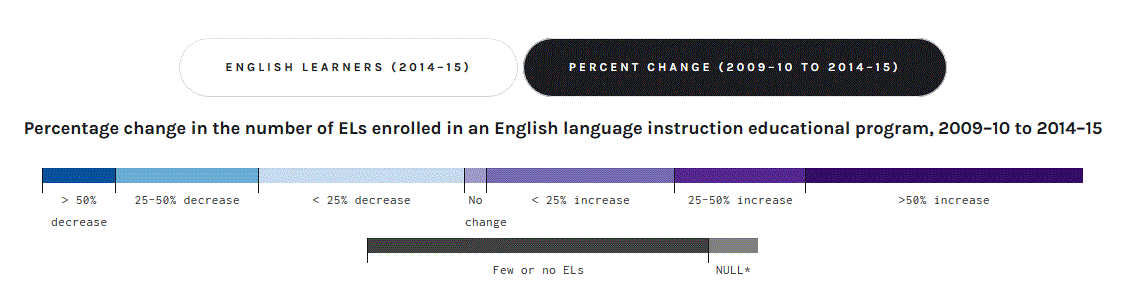
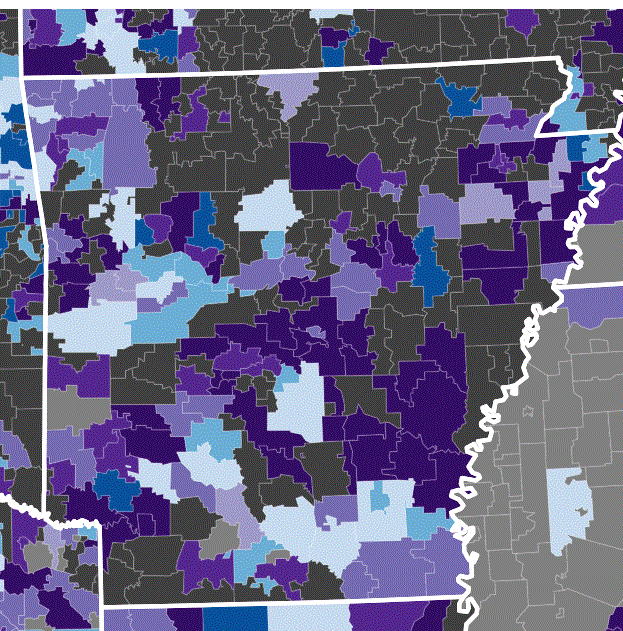
The change in Arkansas’ EL population by district from 2009-10 to 2014-15 is presented below. Most districts had few or no ELs, as represented by black or gray shading, but many districts are colored dark purple, indicating an increase in EL enrollment of at least 50% over the years examined.
With such large changes in the EL population by 2014-15, we wanted to bring in more current data to examine the trends here in Arkansas. Examining data from the Arkansas Department of Education, we describe overall EL enrollment in the state, the proportion of EL students to general population, and the proportion of EL students by academic region for the past 15 years.
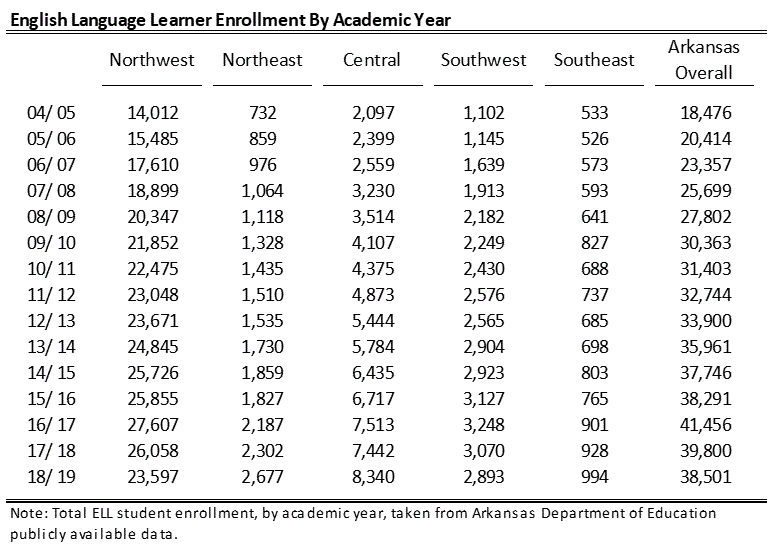
Table 1, below, presents the number of students enrolled in English language learning programs over the last 15 academic years. Overall, the total number of EL students enrolled in Arkansas schools has doubled from just under 20,000 students in the 2005 academic year to just under 40,000 in the 2019 academic year. All regions have seen increases in the number of EL students from 2005 to 2019. In total numbers, the Northwest academic region welcomed over 23,000 EL students in AY 2018-19 – the most by far.
Table 1. EL Enrollment in Arkansas, 2004-05 through 2018-19.
Changes in the proportion of EL students in Arkansas from 2004-05 through 2018-19 are illustrated in Figure 1, below. The figure shows the EL percentage of the general student population in Arkansas, by academic region, and in the United States overall. The available data for the national EL rate, represented by the blue dotted line, reflect that the overall share of the EL K-12 population is consistently between nine and ten percent of the general school population.
Figure 1. Percentage of General Population Identified as EL, 2004-05 through 2018-19.
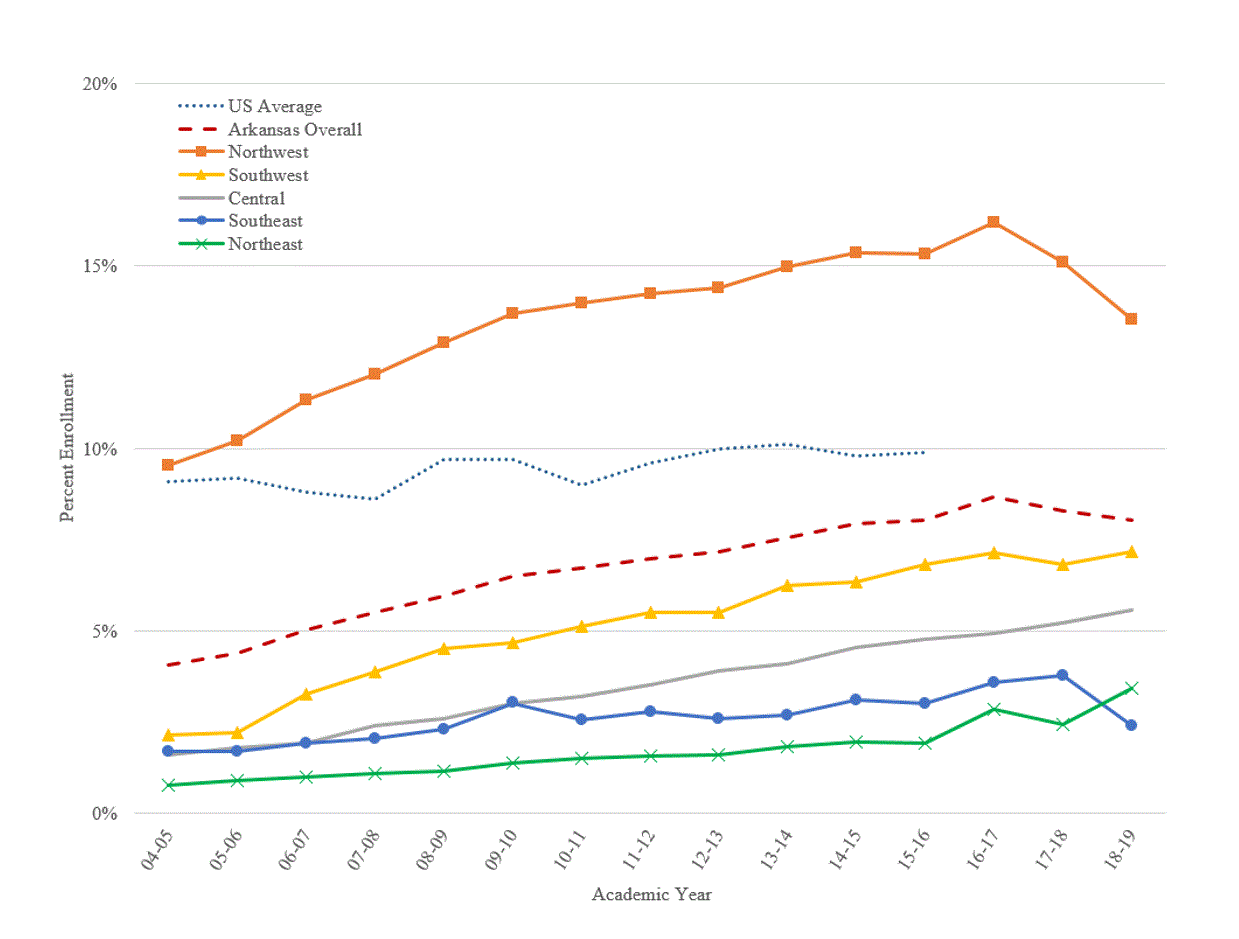
Several key points should be noted from Figure 1.
- Although Arkansas enrolls a smaller percentage of EL students than the national average, the share of Arkansas public school students identified as EL is increasing, from 4% in 2004-05 to 8% in 2018-19.
- While Northwest Arkansas consistently enrolls the highest percentage of EL students in the general student population, both the Southwest region and the Central region have seen large relative increases in the percentage of EL students enrolled.
- A recent decline in the percentage of EL students is also evident in Figure 1. Starting with academic year 2016-17, there is a downturn in the percentage of EL students in Arkansas overall, and a sharp decline in the Northwest region in particular. This decline coincides with a change in the assessments used to reclassify EL students as proficient in English. Beginning in academic year 2016-17, Arkansas replaced the ELDA with ELPA21, and although not evident in all regions, the decline in identified students overall is likely due to a greater percentage of EL students being identified as English Proficient through the new assessment.
In addition to looking at the proportion of ELs enrolled in the general population, we examined which region has the highest proportion of EL students overall and how that has changed over time. Figure 2 illustrates the shift in the overall share of EL students between the academic regions over the last 15 years. While all regions demonstrate growth, Figure 2 illustrates that while Northwest Arkansas consistently has the highest number of EL students enrolled, the region’s proportion of the EL population in the state is decreasing, due, in part, to an increase in the numbers in the Central region.
Figure 2. Share of EL Enrollment by Academic Region, 2004-05 through 2018-19.
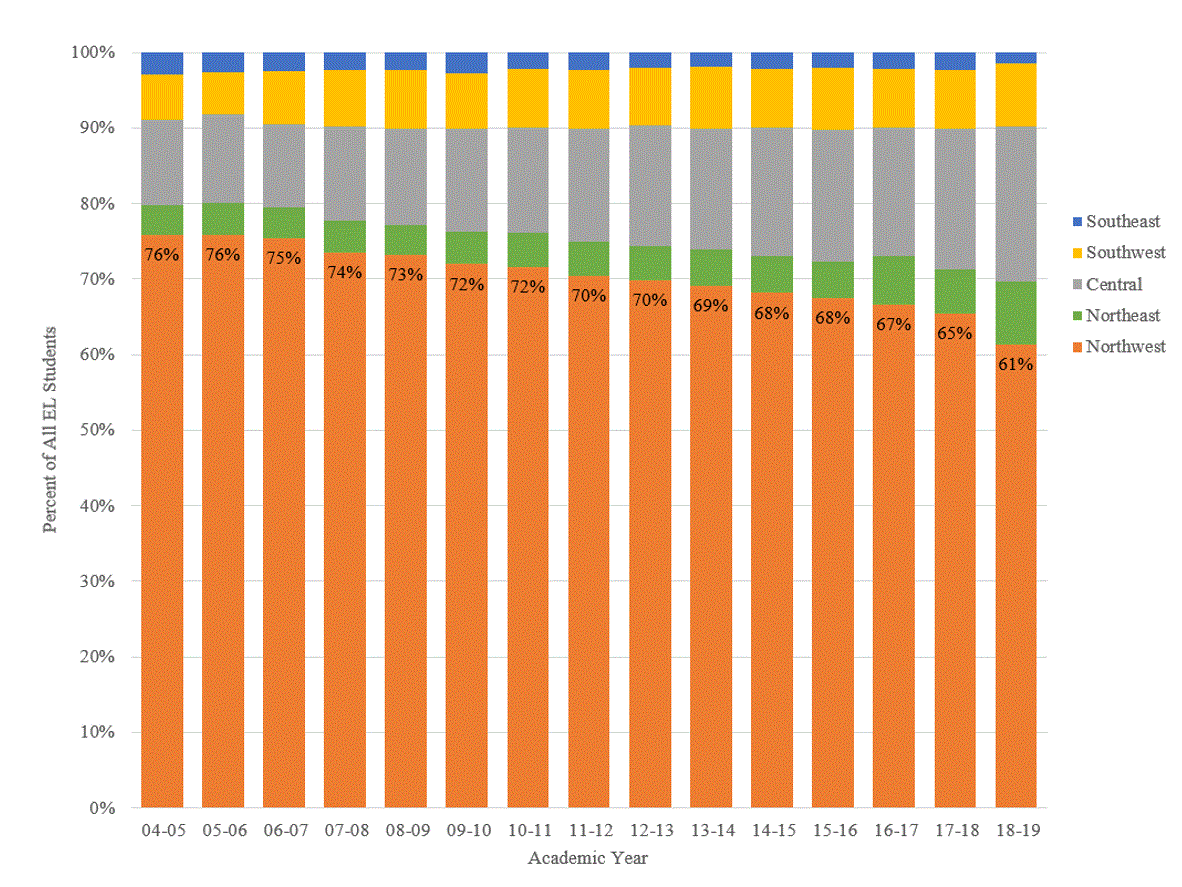 In 2004-05, over three-fourths of the state’s EL students were enrolled in Northwest Arkansas schools. This has dropped to 61%. In contrast, both the Central and Northeast regions have experienced growth in the share of the overall proportion of EL students. The Central region’s share, for example, has increased from 11% to 2005 to over 21% in 2018-19.
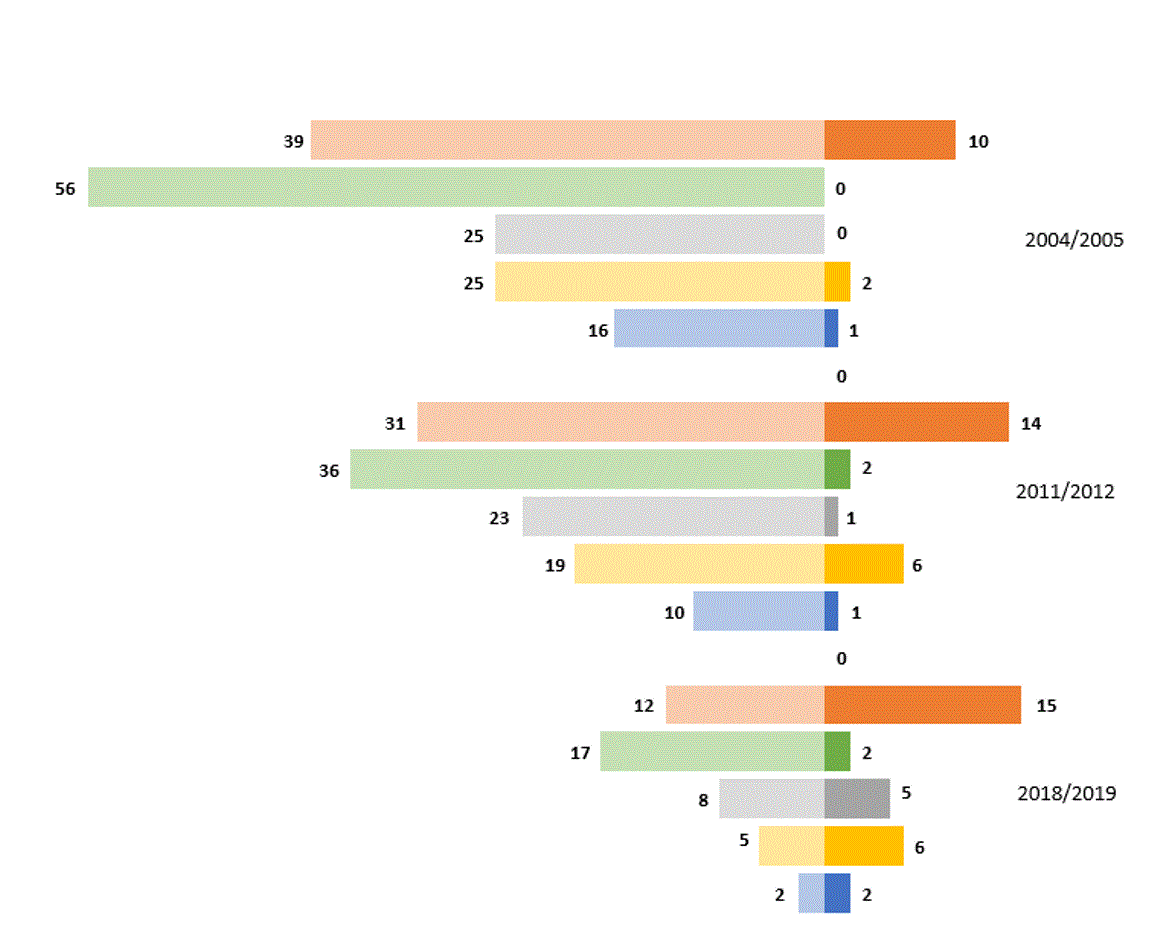
We finally illustrate this major shift in student composition in the state by looking at the extremes – districts with no EL student enrollment and districts with at least 10% of their student population identified as ELs. We illustrate this in Figure 3. While the number of EL students in Arkansas has increased, so has the number of individual districts that enroll these students. Look at the Northeast region, for example. In 2004/05, 56 of the 75 districts in the Northeast region did not enroll a single EL student. None of the remaining districts in the Northeast region had EL enrollments that comprised 10% of the overall student population. By 2019, however, only 17 districts in the Northeast have no EL enrollment and two districts had EL enrollments that comprised over 10% of their student population. In 2019, every academic region of Arkansas has at least two school districts where at least 10% of their student population are English learners.
Figure 3. Share of EL Enrollment by Academic Region, 2004-05 through 2018-19.
![]()
The English Learner student population in Arkansas has more than doubled over the last decade and a half. While the majority of EL students attend schools in Northwest Arkansas, the Central and Southwest regions have higher rates of growth. Additionally, schools in the Northeast academic region account for whittling some of the Northwest region’s share of EL students. The share of EL students in the Northeast has grown by over 2.5 percentage points from 2018 to 2019.
While the number of EL students has grown, so has the number of districts in which they are enrolled. In 2004-05, 155 districts throughout the state enrolled no EL students, but in 2018-19 there were only 44 such districts. In addition, over 30 districts have at least 10% of their students identified as EL, compared to fewer than half that 15 years ago.
The differential growth patterns in the EL population in Arkansas may be problematic for districts that have had few or no EL students enrolled. Districts that have long welcomed EL students may have greater institutional knowledge to identify and support their EL students as they learn and become proficient in English. Districts that have experienced high EL growth, or have recently received their first EL students, may struggle with how best to meet the learning needs of these students. This can be an opportunity for the veteran EL districts to be pedagogical leaders, sharing their expertise with other districts.
It is important to ensure that EL students who attend schools in all regions of Arkansas are afforded the opportunities to succeed in learning English as well as core academic content. In addition to looking descriptively at the educational contexts EL students find themselves in, we will examine how EL students are doing academically in future installments of this OEP blog – watch this space!