
We often think of universities as being on the leading edge of change – and sometimes that is true. But it’s important to take opportunities to reflect on the data and test those assumptions.
That is what Sightlines and the University of New Hampshire recently did in their 2015 report titled “The State of Sustainability in Higher Education.”
In 2008 a significant number of universities wanted meaningful climate action and signed the American College & University Presidents Climate Commitment (ACUPCC). An excellent graphic that was featured in that commitment was the Carbon Management Hierarchy (shown below). It is generally accepted as a “best practice” approach and can be used as a guide for any organization that wants to prioritize their GHG reduction efforts. It’s reminiscent of the old “reduce, reuse, recycle,” but with more details and an energy twist.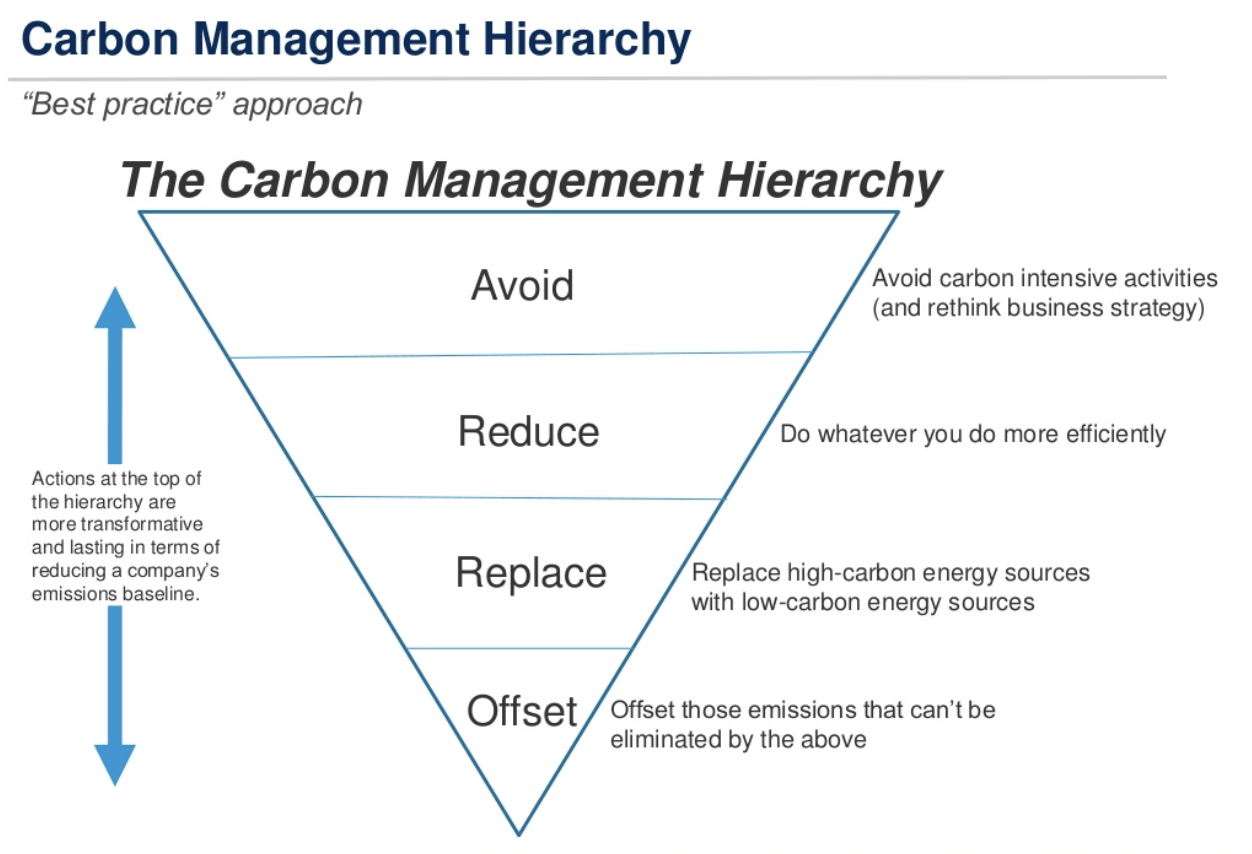
Recognizing a need for measuring and tracking GHG emissions from universities, the University of New Hampshire created a Campus Carbon Calculator as a tool for universities to use to benchmark their emissions. Sightlines used the Calculator as a tool to benchmark many universities across the US, including the U of A.
They were able to analyze data from 343 colleges and universities.
Their research identified several trends among the Universities, showing that gross energy consumption continued to rise, emissions per square foot continued to fall, and that the main driver of change is transitions in fuel. The report covered many more obvious trends, such as schools with more buildings and more students having higher gross GHG emissions, but a less intuitive discovery made by the research.
 The report revealed that public policy was the most prominent factor in GHG emission improvement.
Impressively, GHG emissions have continued to decrease since 2007 while general consumption of energy continues to increase. Emissions from Scope 1 and 2 sources are down a modest 5% over the last four years, while emissions per square foot were down 13% over the last seven years.¹
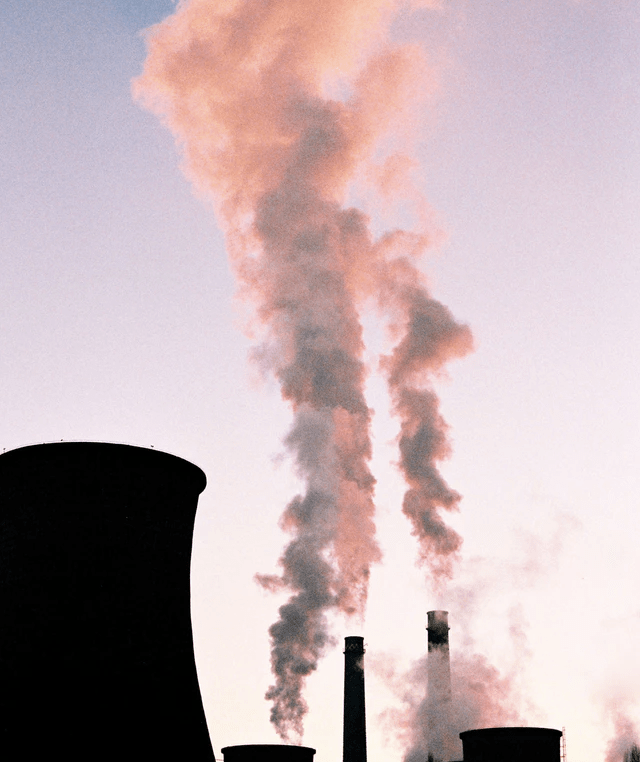
The increase in consumption is understandably due to the expanding enrollment and subsequent infrastructure improvements. The reality is reducing campus carbon footprints was mostly driven by switching from high emission fuels to lower emission fuels. Since 2007, the fuel mix has grown from 74% natural gas to 87% natural gas.¹
This means that while the emissions of Universities are decreasing, it’s not actually due to green innovation.
These decreases in emissions due to the transition away from coal and towards natural gas is not unique to higher education. According to the US EPA, that trend is nearly the same throughout all major US industries.²
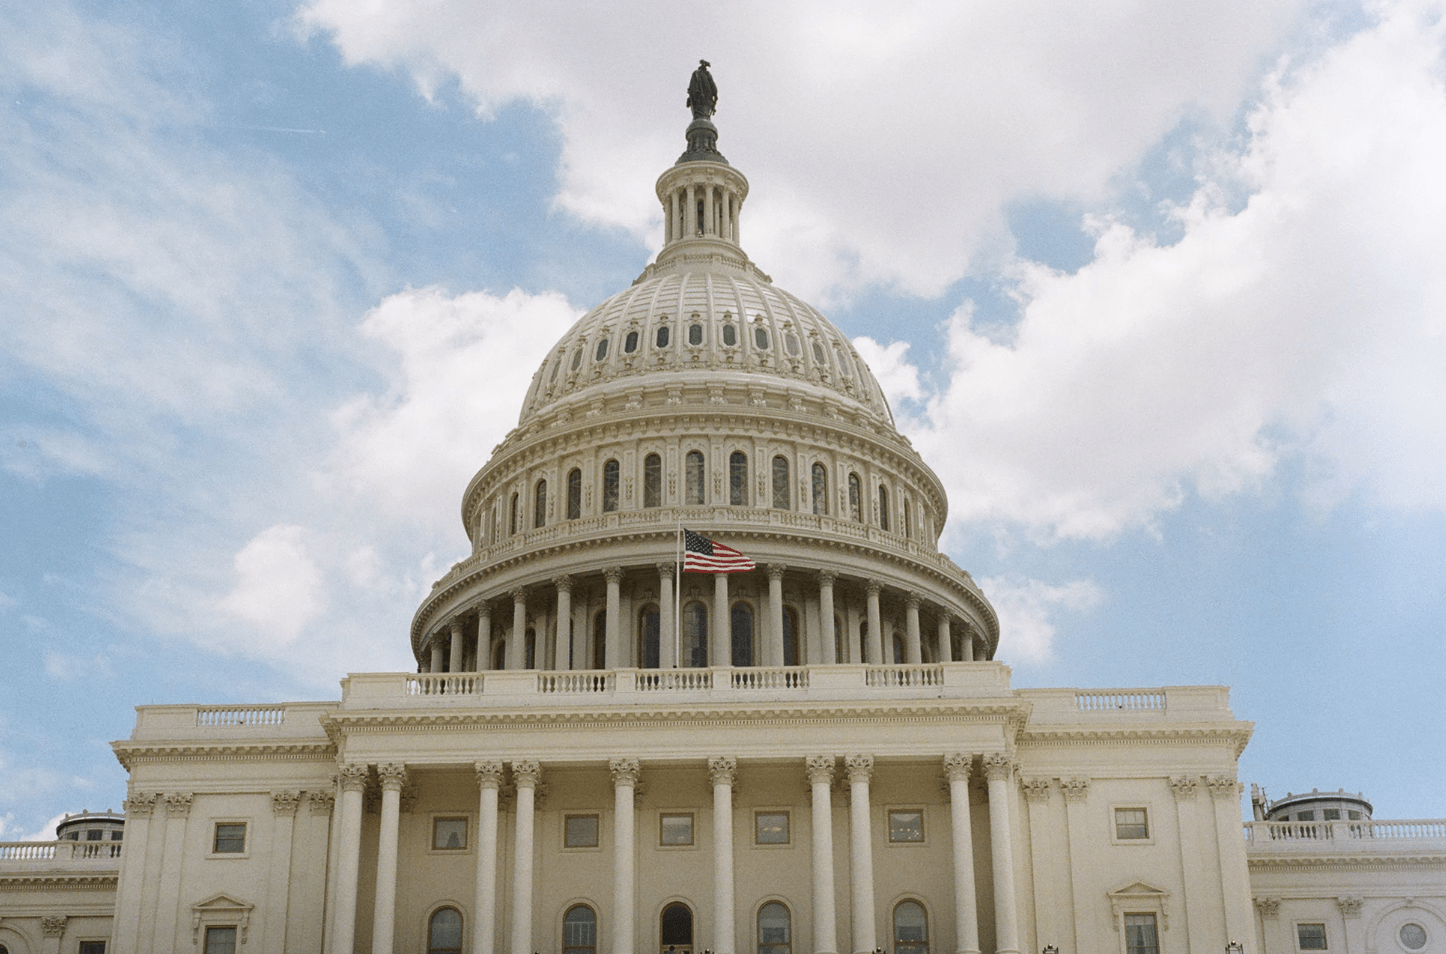
 That is a hard pill to swallow. So often, we feel like universities are at the leading edge of change, and while there is some truth to that, many of the carbon neutrality efforts that are occurring on campuses get lost in the noise. Significant changes to our annual emissions are really driven by the energy mix that is available in the particular region. But the study did leave us with some hopeful news – we still have public policy as a tool to fight for GHG emission improvement. Public policy has the ability to drive significant reductions in emissions without having to modify day-to-day operations.
A less surprising finding of their study was that energy consumption is higher at universities where their cost per unit of energy is lower. This observation again shows us that Universities will not change practices without an economic intensive, and points us towards public policy playing a significant role in emission reductions. According to the American Council of Energy Efficiency Rankings³, Arkansas is ranked 31st, but was granted one of three gold stars in 2014 which represent the most improved states. It is also important to understand that not all state’s are emitting the same. Institutions in states that rank in the bottom third of the policy scorecard have 72% more GHG emissions than states in the top third.¹
Another factor in making progress on emission reduction targets is whether or not the school has signed the American College & University Presidents Climate Commitment (ACUPCC).
Schools who have signed consume an average of 27% less BTUs than schools who did not sign.
More impressively, in terms of GHG per square foot of building, signatories have on average 47% lower emissions.¹ Obviously, this correlation does not equal causation, but it is an interesting statistic regardless of the forces. Luckily the U of A was a charter signatory of the ACUPCC and is now moving towards an even more comprehensive commitment know as Second Nature’s Climate Commitment. The UA Sustainability Council is currently voting on whether or not to endorse the new commitment to Chancellor Steinmetz.
The takeaway message from this analysis of emission data from 343 colleges and universities?We need to get out and vote. At this time progressive public policy is the number one reason that GHG emissions are going down. Lets keep the momentum.
¹ http://www.sightlines.com/insight/state-of-sustainability-in-higher-ed-2015/
² http://www3.epa.gov/airtrends/reports.html
³ http://database.aceee.org/state/arkansas