

Tableau Mapping Tutorial
Dataset for this tutorial: sample-superstore
Link to transcript for basic mapping tutorial
And…the tutorial
Note: This tutorial uses a dataset that is slightly different than the one we are using. It lacks international data and some of the fields are under different names. See the notes below.
Class Assignment: Create the maps described in this tutorial.
Map Layer
Data Layer
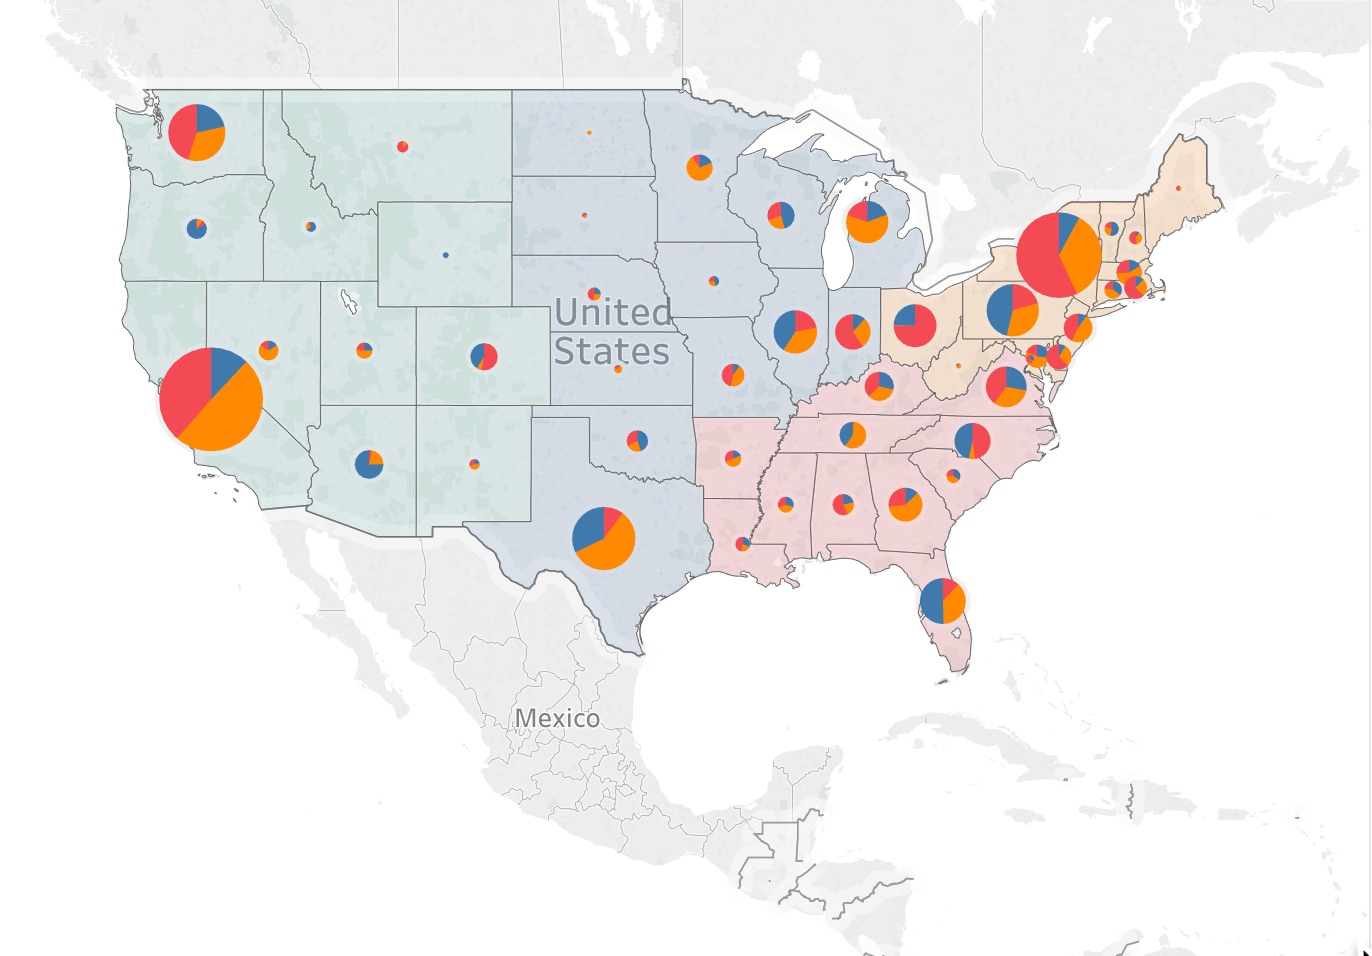
Size and Color
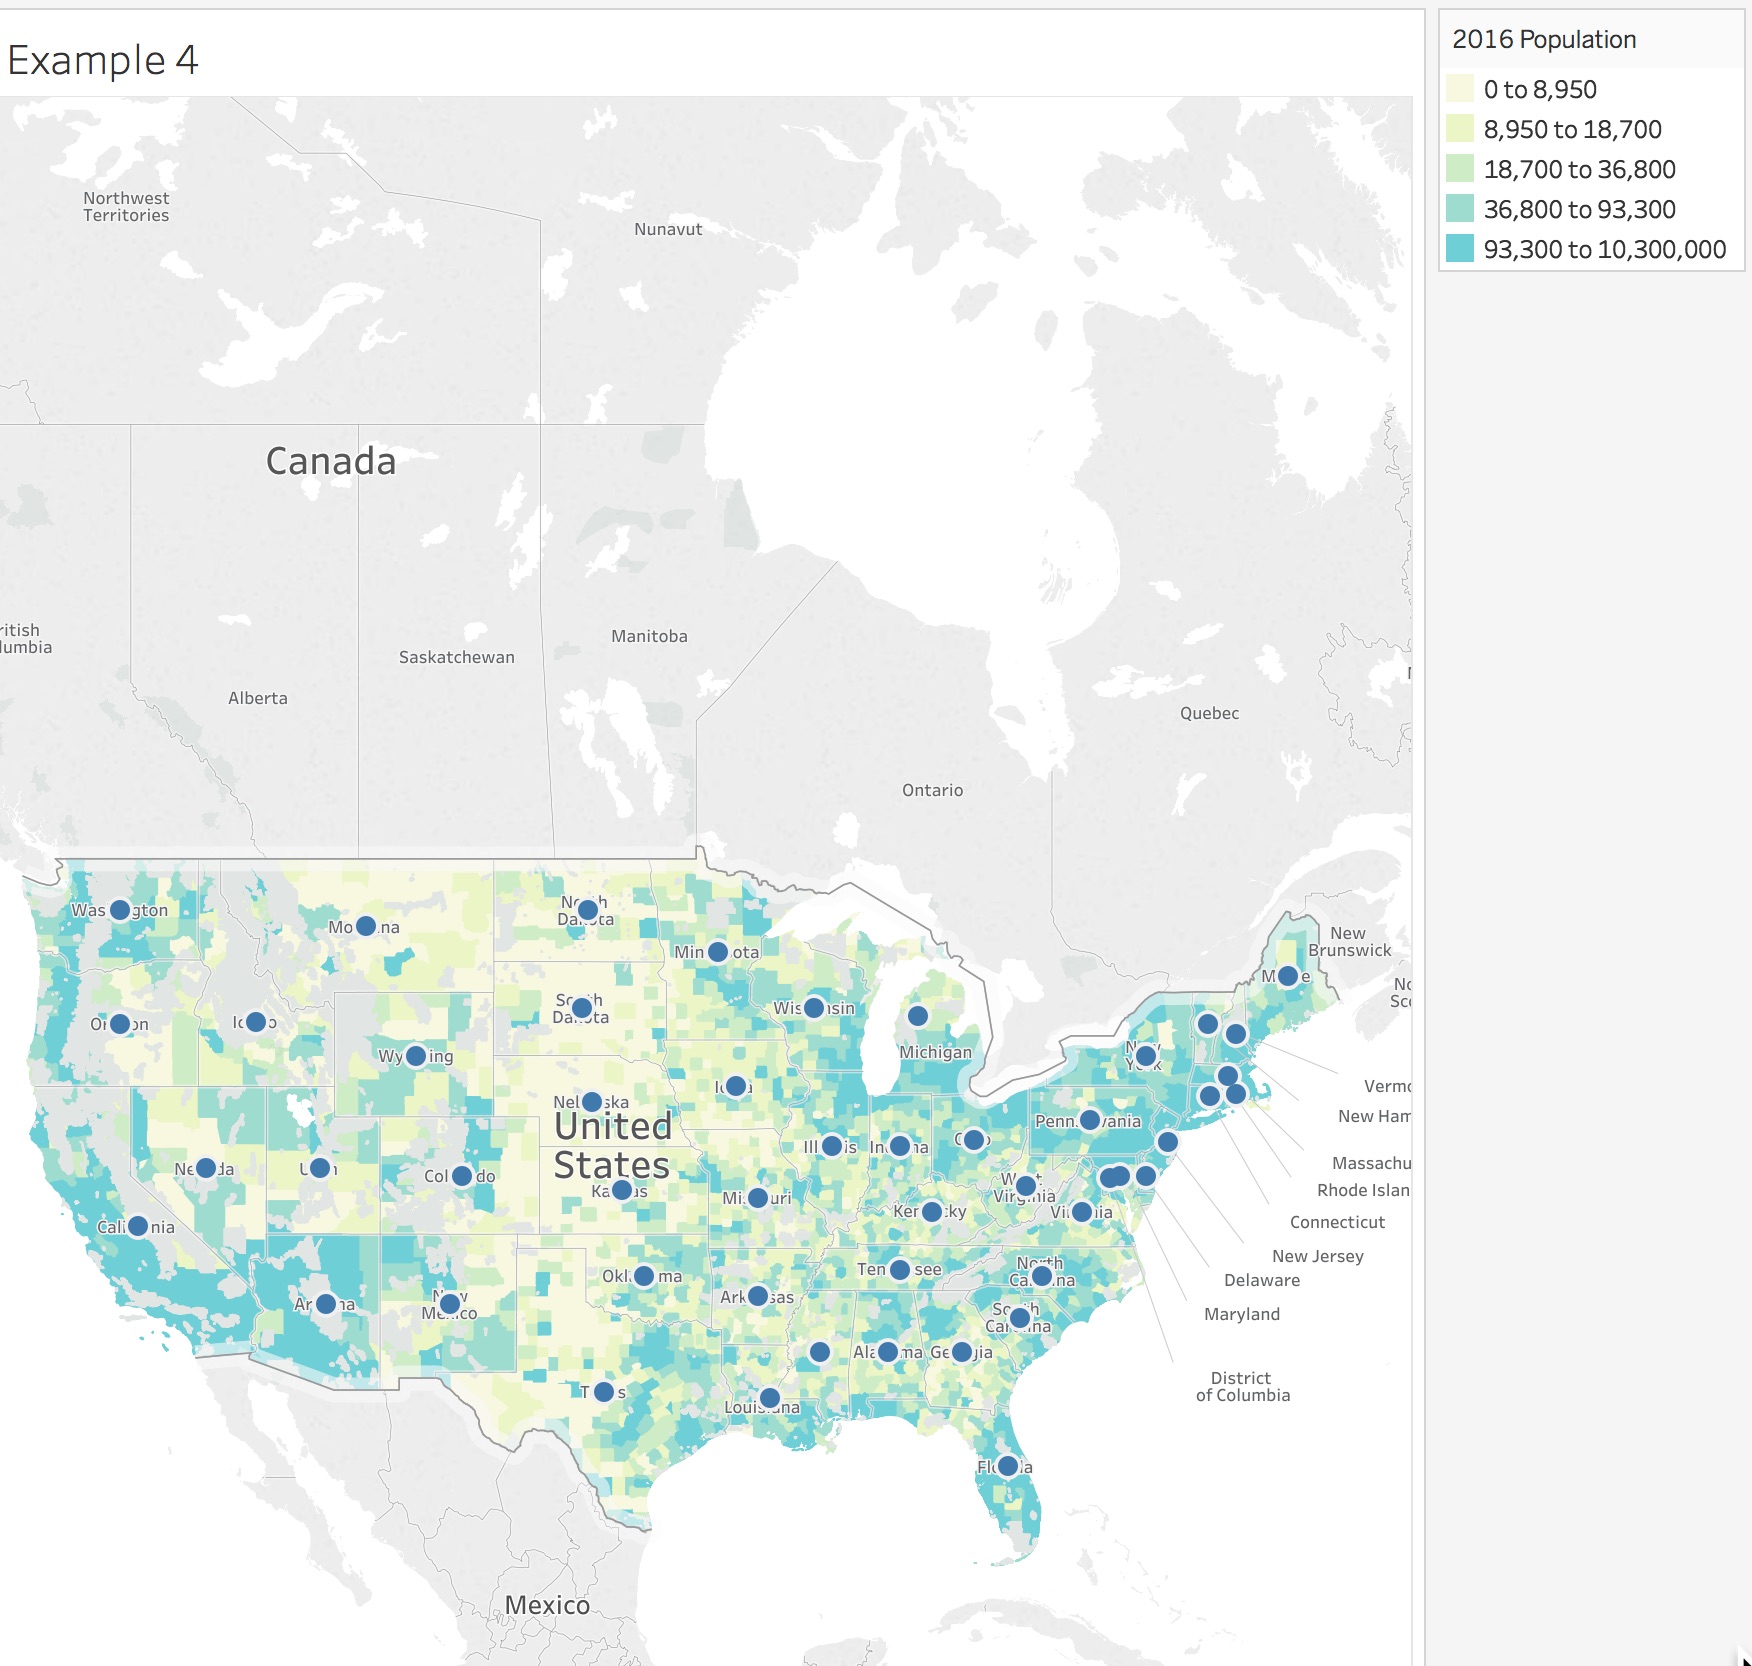
Filled
Small Multiples
Dual Axis
Mapping Crime
Arkansas Crime Data
#1: Import Crime Data Into Tableau, Use 2014 Tab, Try to Map Counties
ARK 2010-2014 Crime Data-Tableau-Feb22
What’s wrong?
Problem: FBI Data Doesn’t Map in Tableau
How to Solve This?
1) Link to Zip Codes
2) Link to Latitude-Longitude Data
3) Give Up and Hide
Use Relational Databases to Match Our Data – HMDA – To Another Database with Zip Codes
A) Link to Zip Codes
HUD USPS ZIP Code Crosswalk Files
—4th quarter of 2014
Homework for Thursday: Mapping Crime
The FBI database has a mix of cities and counties. Tableau does not know what to do with this and therefore we can’t map the data.
The challenge is to fix this. I can think of three different ways to do this. In class, we took the first step by cleaning “Agency” names in FBI Data and classifying them as cities or counties.
Your homework assignment is to pick one of these options to fix the mapping problem and produce a Violent Crime Rate map for Arkansas. Give one of these options a shot. Make notes on where you succeeded or got stuck and share with the class. Or come up with a better option! We will explore all three in class on Thursday.
Option #1: Prepare data to link to a Zip Code database within Tableau
Option #2: Add a new zip code field in the FBI data and use =vlookup to add the zip code data to the sheet, and import it into Tablueau
Option #3: Split the data into separate cities and counties columns in Excel. Mess with Tableau’s “map options” function to force it to recognize the cleaned agency names as geocoded entities. Create a dual axis map.
Post your success or failure in a brief blog post by 11:59 pm Wednesday. Good luck.