Homework and Images
Create .jpeg – cut out captions
Upload into WordPress
Change the image settings: Large and link to media file, not to the link.
Tableau Calculations
Introduction to Calculations Transcript
Table Calculation: Add a new column that adds the Wait Columns Less than 7, 14 and 30
–In Measures Data Tab, Left Click on Less than 7 Days, Create Calculated Field
–Put in this formula: sum([Appts Under 7])+sum([Appts Under 14])+sum([Appts Under 30])
–Rename This as: All Apts Less 30
Drag Names to Columns
# All Less 30 Days to Rows
# Tot Appt to Rows
Select Side by Side bar graph in Show Me
Part 2: Add % of Total Calculation
Resume with the visualization above
-In Data Pane, left click on # All Apts Less 30 Days
-Create calculated field
-Use this formula: All Apts Less 30/sum(Tot Appts)
-Rename it % 30 Days and Less
-Drag % 30 Days and Less to Labels on Marks Card
-On Tot Appt Bar, Left Click: Mark Label, Never Show.
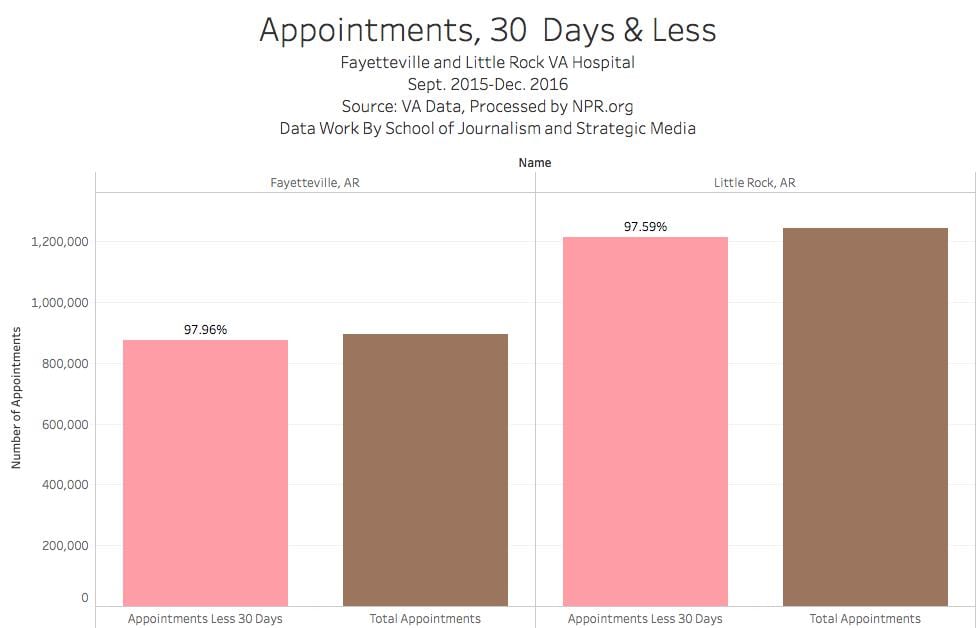
You should have a chart that looks something like this:
VA Workforce
Data Dictionary
-
- va_dump_full_time_employee
- ● station_id: VA station identification code
- ● name: VA station name
- ● ref_date: Date when the information was extracted from the original source
- ● visn_id: VA Veterans Integration Service Number
- ● prioritized: Stations that were designated to receive additional funding
- va_dump_full_time_employee
○ 1: prioritized, 0 otherwise
-
- ● occupation_id: Occupation code
- ● occupation_desc: Occupation description
- ● employees: Number of employees
- ● state: Facility state
- ● address: Facility postal address
- ● postal_code: Facility postal code
- ● latitude: Facility latitude coordinate
- ● longitude: Facility longitude coordinate
- ● phone: Facility phone number
- ● fax: Facility fax number
- ● url: Facility website url
Homework
Question: What is the percentage of the different occupations (nurses, police, etc.) of the whole staff in Fayetteville, Little Rock?
Create a chart in Tableau. Export a .jpg image and post on the blog.
Due Wednesday 11:59 pm
Columns: Name
Rows: Occupation Description
Text (Marks Card): # Employees
–Click Sum # Employees Green Pill on Marks Card. Add Table Calculation.
–Compute Using Table Down
–Percent of Total
Drag # Employees to Text Again
Bonus: More Shapes
Tableau loads with a limited library of shapes.
You can change that
- https://www.interworks.com/blog/ccapitula/2015/01/16/tableau-essentials-formatting-tips-custom-shapes
- https://lechuck80.deviantart.com/art/Whatsapp-Emoji-Collection-357910493