Terry Gross On Interviewing
______________________________________________________________________________________________________________________
Gear
Using the Zoom H4N Recorder
https://snapguide.com/guides/use-a-zoom-h4n-handy-recorder/
Editing audio
Not so free software: Adobe Audition
______________________________________________________________________________________________________________________
Adobe Audition Editing Drill
File | Import | Filename .. xxx.wav
Play audio. Controls at bottom.
Expand view — Magnifying glass: Zoom In – Time
Define / Highlight section to cut.
Edit | Cut
Save As New File – Adobe Audition File
Export as an .wav file.
Sample Rate: 44100. Stereo. 24 bits.
Assign correct folder
Fade in and Fade out Audio
https://helpx.adobe.com/audition/how-to/audition-add-audio-fades-cc.html
______________________________________________________________________________________________________________________
Free software for your laptops
https://www.audacityteam.org/download/
Jon Schleuss – March 1

______________________________________________________________________________________________________________________
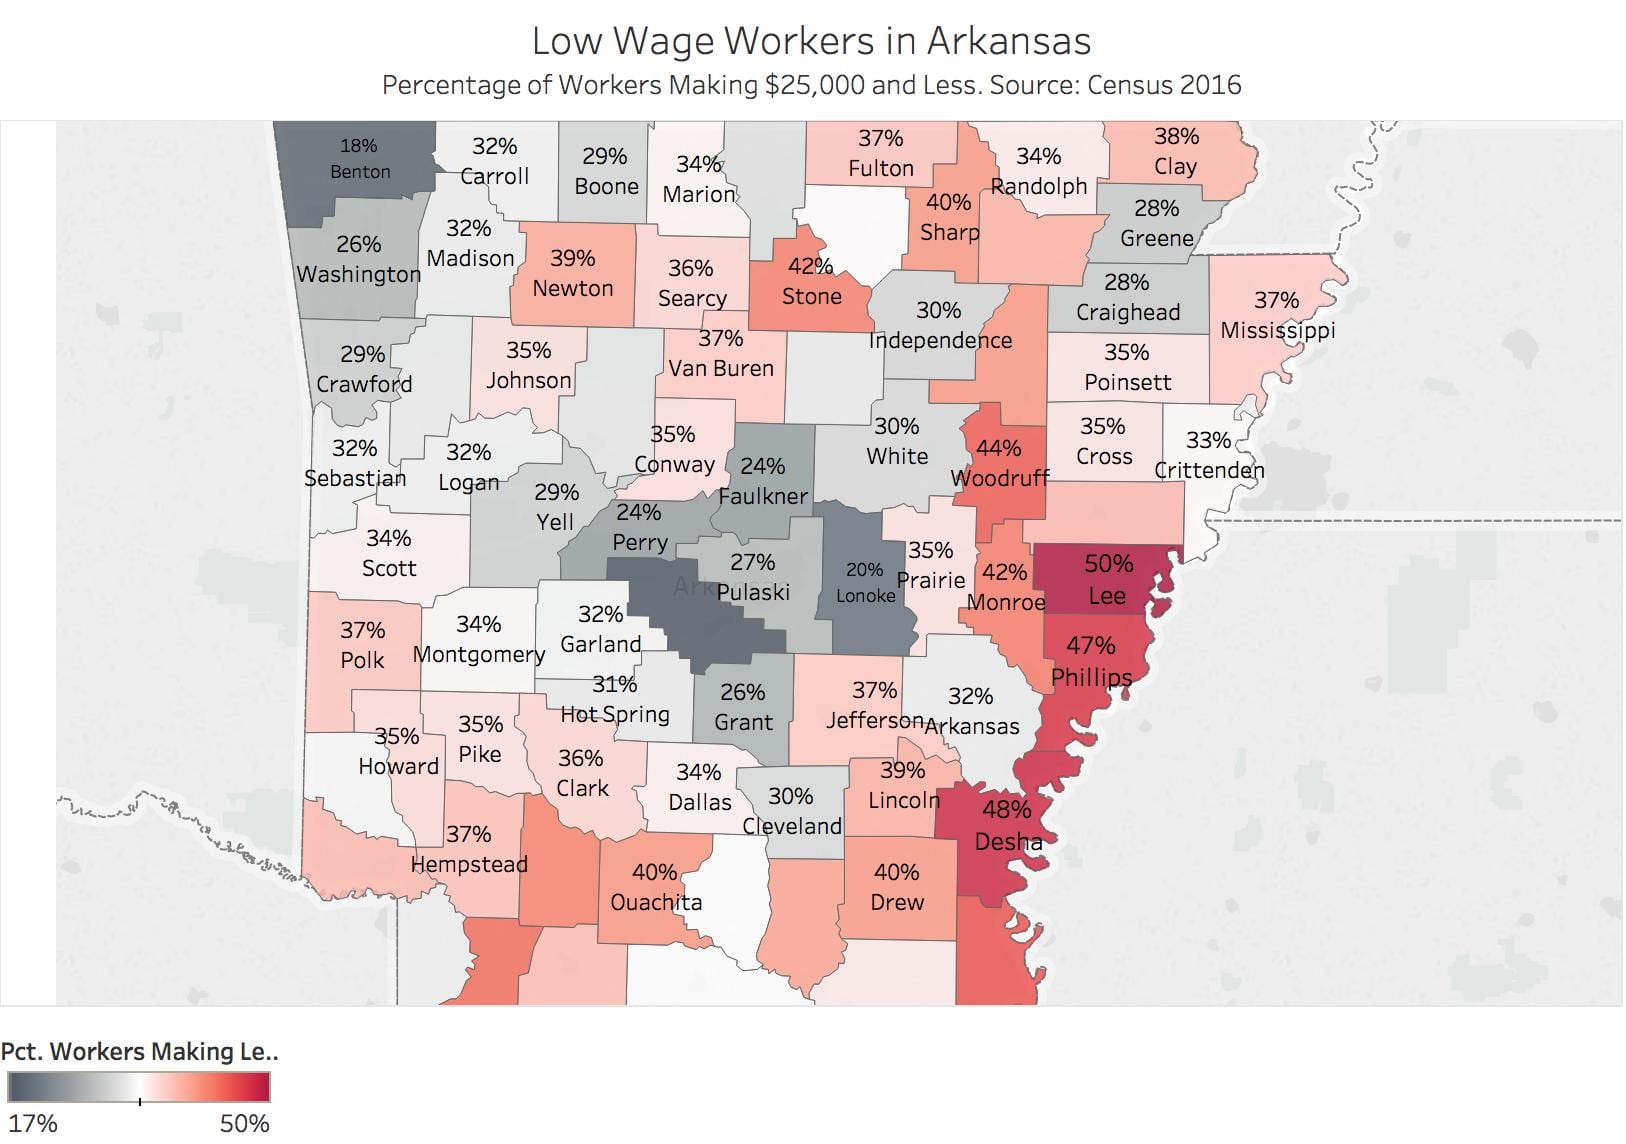
Map Low Wage Workers in Arkansas
Use US Ark Counties Poverty ACS_16_5YR_DP03 – Poverty Income
In Dimensions, copy Geography (cntl + click, duplicate). Rename Geography1
Then convert the data to Geography
–Geographic Role | Counties
Drag Geography1 to Columns. % Total Under 25k to Rows
Select Map Icon under Show Me.
You should have the state of Arkansas and dots within the borders.
Not all show up! To fix:
Top Menu Bar:
Map | Edit Locations | State – Change to Arkansas
Magic!
(Arkansas and United States don’t show up – deal with that later)
Color, Label, Format, Name counties.
Marks | Maps will fill out the geographies.
Fiddle, Tweak, Obsess
Fiddle, Tweak, Obsess
Fiddle, Tweak, Obsess
______________________________________________________________________________________________________________________
Mapping in Tableau

______________________________________________________________________________________________________________________
Create a Reference Line for Poverty
Use the US Ark Counties Poverty ACS_16_5YR_DP03 data – the income-poverty data.
Fire up Tableau
Step 1 – Build the View
- Drag % Female Households – Children 5 Years to the Rows shelf.
- Drag Geography to the Columns shelf.
Step 2 – Create Parameters
- Right-click in the Data pane and then select Create Parameter.
- Name the parameter “Arkansas Average”.
- Under Data Type select Integer.
- Under Current Value, set to 55.8
- Under Allowable values select All.
- Click OK.
Step 3: Create the calculated field
- Select Analysis > Create Calculated Field.
- Name the calculated field “Reference Line”.
- In the formula field, enter the following formula:
- IF[% Female Households – Children 5 years younger]=[Arkansas Average] THEN [Arkansas Average] END
- Click OK.
Step 4 – Use the calculated field as a Parameter Control
- Drag the “Reference Line “calculated field to Details. This is the box below Color in the Marks Card
- Click the arrow to change the measure from SUM to Minimum.
- In the view, right-click on the Y axis and select Add Reference Line.
- In the Value drop down menu, select Minimum(Reference Line).
- In the Label drop-down menu, select Value.
- Click OK.
______________________________________________________________________________________________________________________
Homework
—Post two questions for Schleuss here.
–Fix your graphics so I can send them to Schleuss and Ampezzan this weekend. Email me when you’re done
—Finish Assignment #2 : Due 11:59 p.m. Wednesday, Feb 28. Post on WordPress.