Happy Fall


.

Sign Up to Check Out Gear

camera-equipment-checkout-roster

Equipment Checkout Hours:


Monday

10 – 12

3:30 – 5:30

Tuesday


1 – 5

Wednesday

10 – 12

3:30 – 5:30

Thursday


1 – 5

Friday

10 – 12

3:30 – 5:30


Use the CHEQROOM App to reserve equipment.

Checked out items must be returned within 24 hours. Late fee is $20 per day.

If you would like to extend a reservation or cancel please call (479) 575 4661 during open hours.


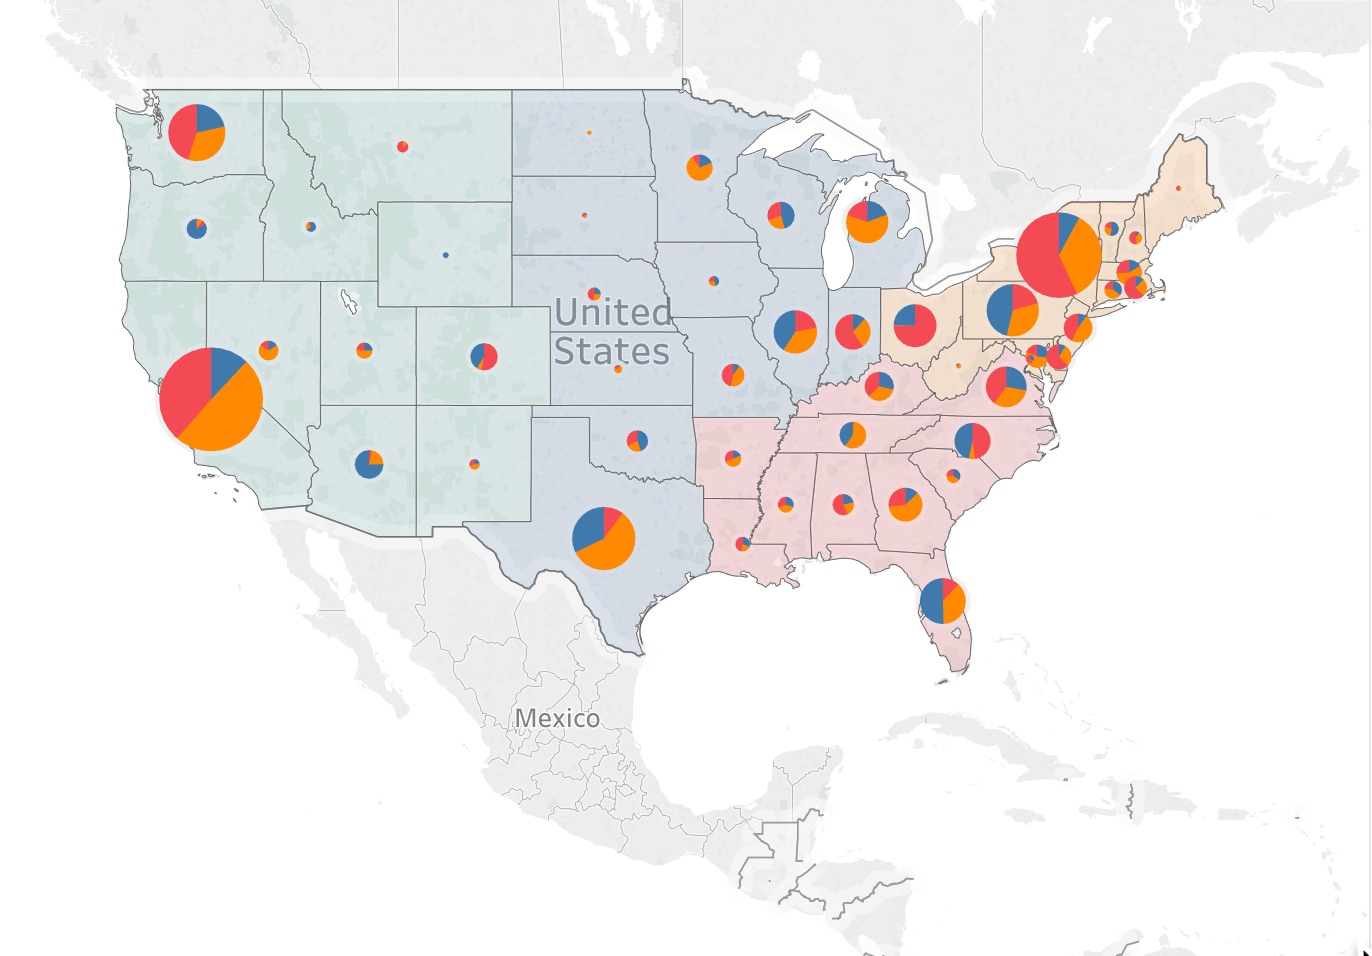
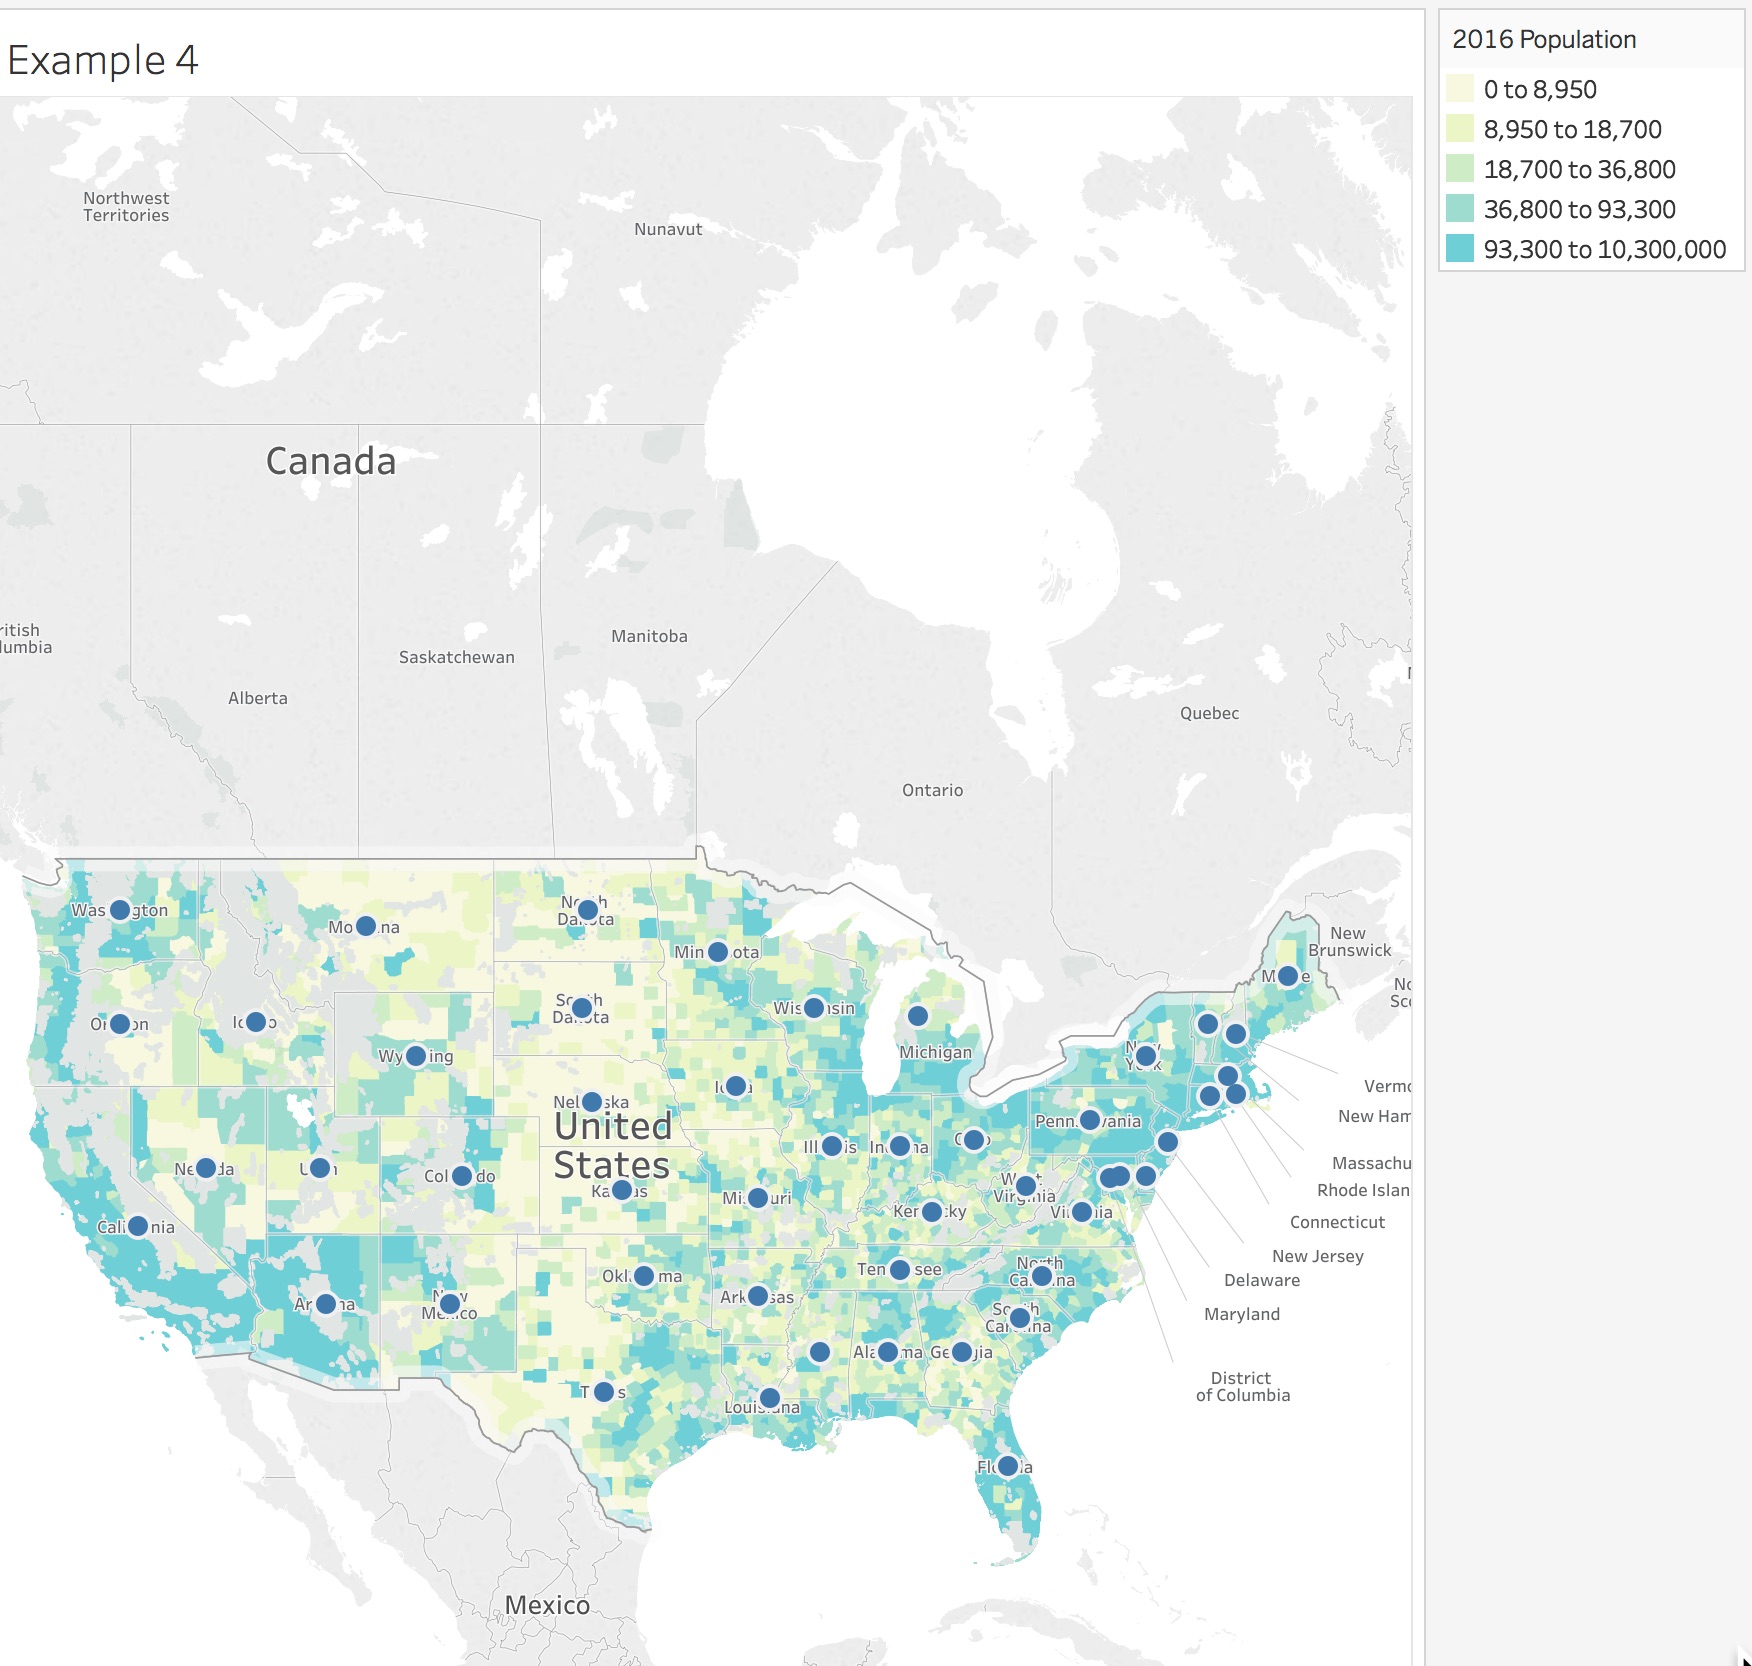
Tableau Mapping Tutorial

map1

Dataset for this tutorial: sample-superstore

Link to transcript for basic mapping tutorial

And…the tutorial

Note: This tutorial uses a dataset that is slightly different than the one we are using. It lacks international data and some of the fields are under different names. See the notes below.

Class Assignment: Create the maps described in this tutorial.

Map Layer
Data Layer
Size and Color
Filled
Small Multiples
Dual Axis

map2


PROJECTS LIST

Upload your finished project to a new blog post. Name it “Project – Your_Name” 
David:
– Revised Applications by Rejection Rate, 10-31-16
—eliminate the N/A
Julia:
Revise “reasons for denial HMDA data”
cut out the information not provided by applicant and consider normalizing these as a percentage of all applications.
Nanci:
Acceptance Gender and Race
the Y axis — it says “value” – what is it? percentage of something. it needs to be labeled. Also, having labels on the bars would be really useful.
Revise Loan Purpose: Refinance from 10-31
—eliminate Grand Total
—New chart Title: “rejection rate for loan refinancing, 2014, NW Arkansas”
—Label the bars
Taylor Pray:
Revise Rate of Denials by Race
—Cut info not provided by applicant.
—Eliminate the legend
Ashton:
put the source of the data in the title slide, HMDA 2014 , FFIEC. Change the “value” on X axis to number of incidents.
Quincy:
Chart #3 – I would cut out the info not provided by applicant in the Hispanic denial chart. Fix the X axis label to show just “Count of Denial Reasons”
Chart #5 – Loan Amount average by race – Let’s fix this and get dollar signs on the labels. I want to double check your spreadsheet calculations on this too.
Chart #6 – Rejection reason by minority population. Let’s sort it – highest to smallest, L—>R. Get rid of the null category.

Homework, Due 11:59 pm Wednesday, Nov 9.

The teams hand in a joint news article, about 500 words, based on your interview. Include relevant data from our ongoing research. One article per team – credit everyone involved on the article, one blog post per team.

Group 1: Trupp, Monk and Ball: Marshallese community

Group 2: Flores, Messina, Lyster, Billmyre: Hispanic community

Group 3: Dobrin,Thomas, Taylor Pratt: Bankers in the Northwest Arkansas area

Group 4: Taylor Pray, Eley, Ward: Asian community