
UPDATE: DOW JONES TESTS ARE 8:30 am-11 am
in the Lemke Newsroom Tomorrow

Arkansas Public Media
Bobby Ampezzan
Interviews
- Bring a Digital SLR Camera and a Audio Recorder to the Interviews.
- Tell the people we will be using a fact-check process and someone will be calling back to double-check facts from this interview before we publish. Obtain the email address and cell number of each person you interview and put that on the interview sheet.
- I need a FULL VERBATIM TRANSCRIPT of each interview. I need the audio files. No exceptions. Upload transcript, audio and images to Google Drive space for our class: https://drive.google.com/drive/folders/0B9N10qKqBa2zVGtWbVctNU9kZTQ?usp=sharing
Trupp, Monk and Ball: Marshallese community
Flores, Messina, Lyster, Billmyre: Hispanic community
Dobrin,Thomas, Taylor Pratt: Bankers in the Northwest Arkansas area
Taylor Pray, Eley, Ward: Asian community
–Quincy includes questions based on his immigration & salary research for Asians.
For each group, gather the data and information to ask the following questions:
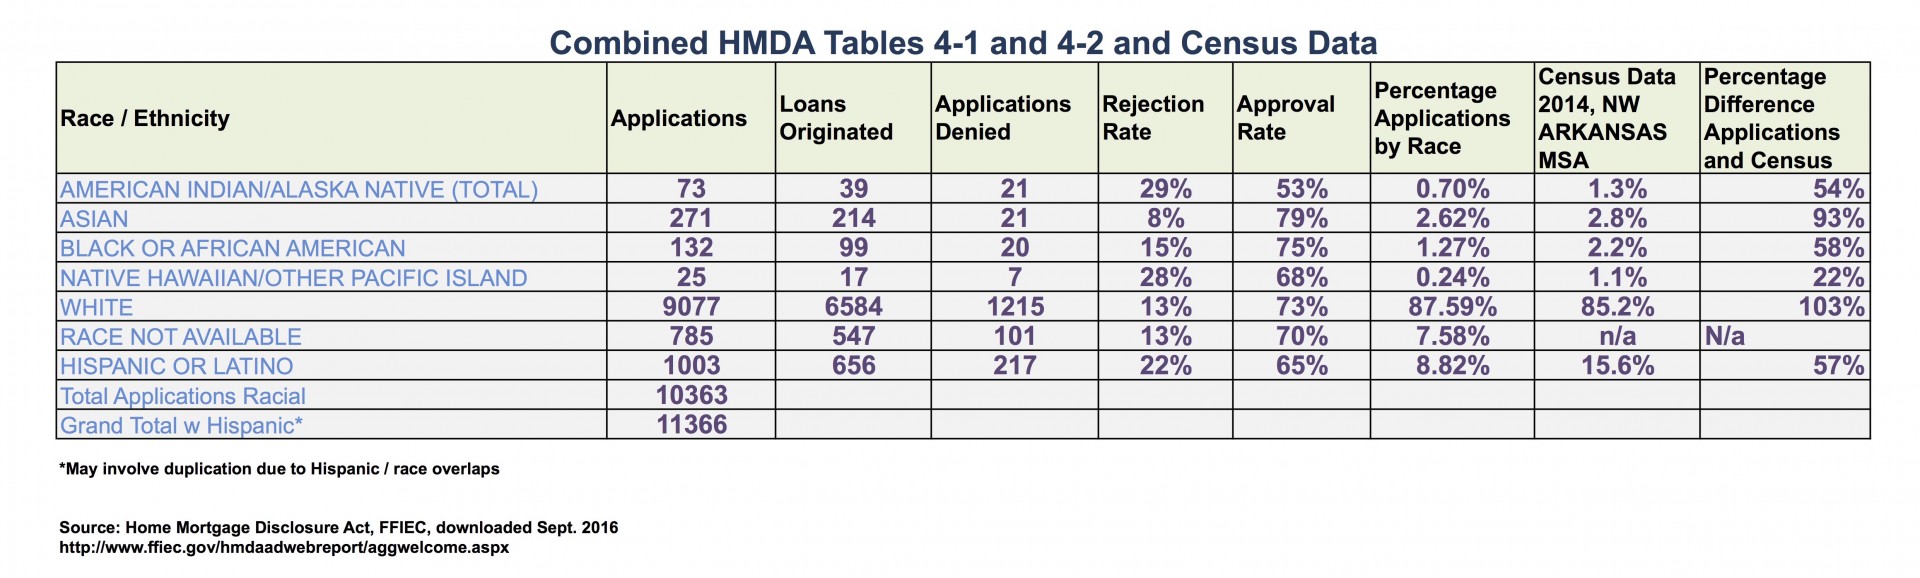
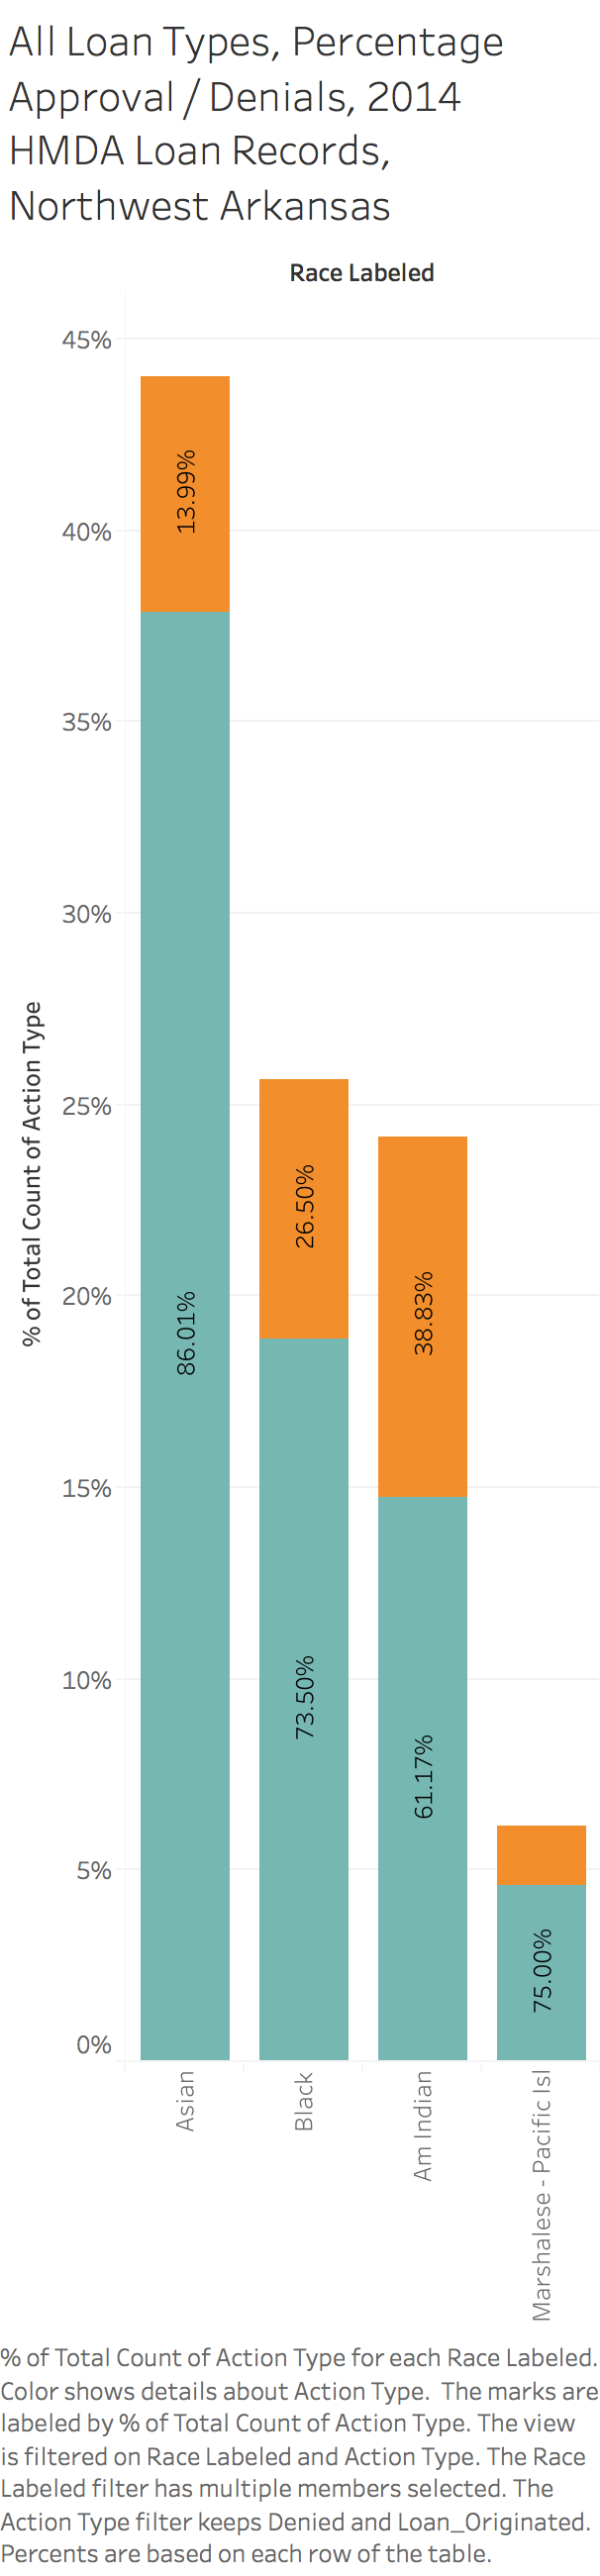
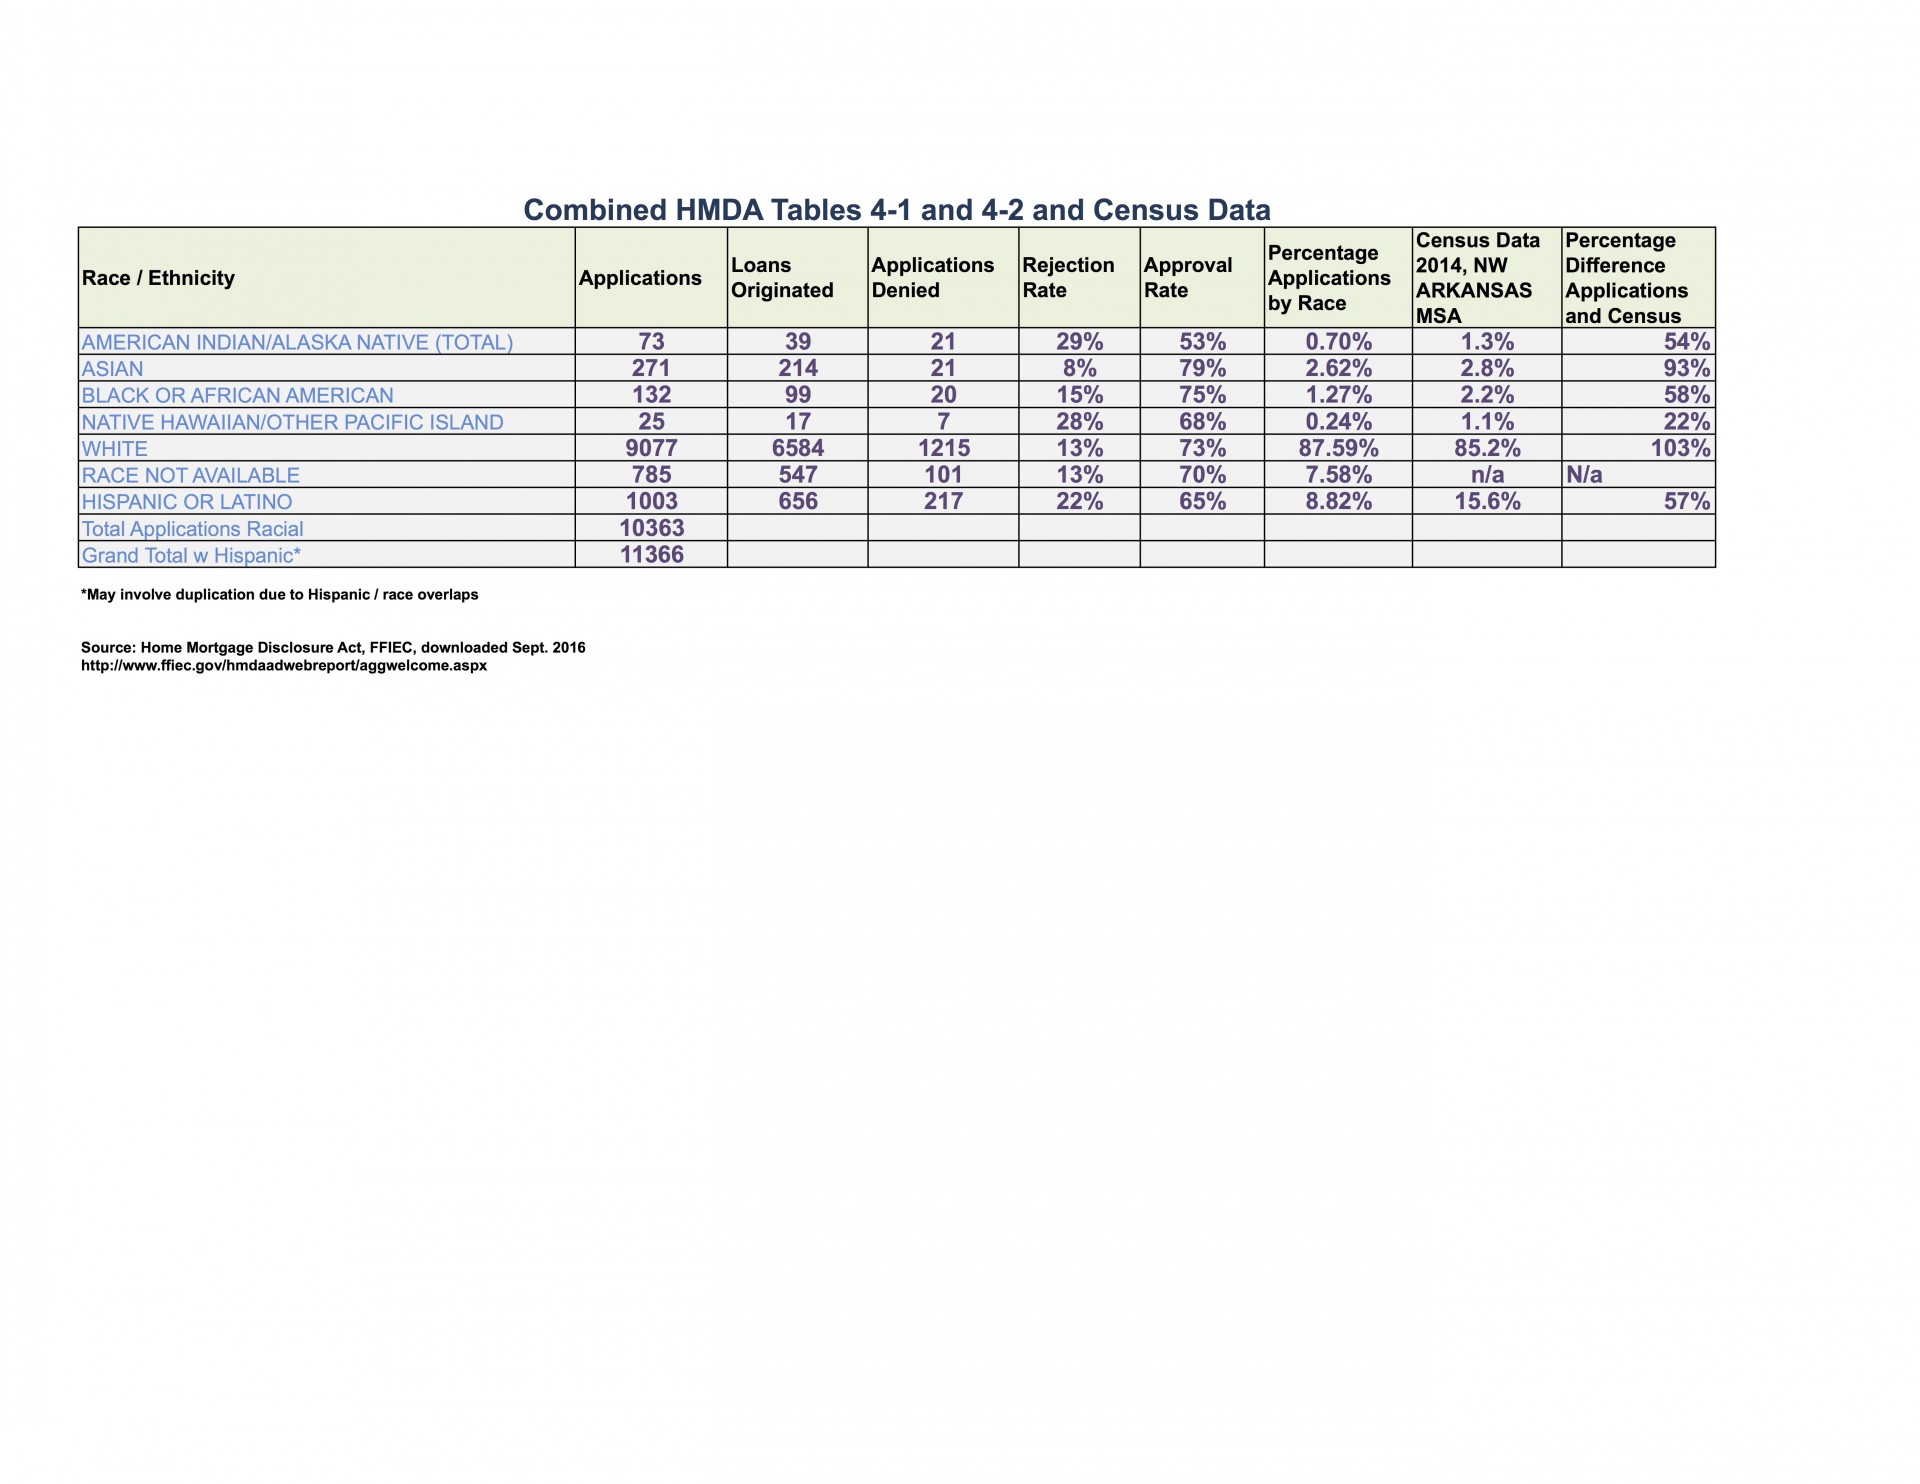
–Rejection rate for combined conventional and FHA mortgages in 2014 and how that compares to whites.
–Median household income for these groups vs whites
–What is the trend for these groups prior to 2014.
–How the banks perform outreach or marketing to their communities.
–Additional questions based on your research.
–A specific game plan telling me when and how you are going to conduct these interviews and divide up the labor.
Options could be your group picks one person to make the calls and the others will do background research to prepare for the interview or will transcribe the recording afterwards. Another option is the entire group goes to the interview. Another option is two people do the interview and a third person does charts or some new data work.
This page will have some useful background for the assignment.
Validate HMDA Flat Files
We have processed the data extensively. Now let’s check to make sure we did it right by validating the Flat Files against earlier work.
Data validation is a key part of data journalism, a methodical and somewhat tedious process to ensure we have a firm base by which to conduct further analysis.
- Compare the 2014 Flat Files to the totals in the Aggregate Totals spreadsheets.
A) Compare the record layouts. What is different between the FLAT FILES and the Aggregate Table 4-2? How do you fix that?
B) Do the math and compare the totals in the flat files to the Aggregate Table 4-2.
Use a Pivot Table to filter the following: By race, DISPOSITION OF APPLICATIONS FOR CONVENTIONAL HOME-PURCHASE LOANS, 1- TO 4-FAMILY AND MANUFACTURED HOME.
How are the numbers different and how are they the same?
2. Perform New Aggregate Calculations on 2014 Flat Files, Rejections By Race
–Use a Pivot Table
–Compare the discrepancies between this data set and the earlier calculations on Tables 4-1 and 4-2.
–What are the major differences?
–Explore the Flat File Data to determine the discrepancies between this data and the Tables 4-1 and 4-2. Do the loan types make a difference? The loan purpose?
Background:
https://www.ffiec.gov/hmda/hmdarawdata2015.htm#by_msa
CODING SHEETS
“File Formats & Documentation (PDFs)”
See Code Sheet, Inst Record Format, LAR Record Format, MSA Office, Reporter Panel
Trupp, Monk and Ball: 2015-Banks
Dobrin, Thomas, Taylor Pratt: 2015-LAR by NW Arkansas MSA
Flores, Messina, Lyster, Billmyre: 2014-LAR by NW Arkansas MSA
Taylor Pray, Eley, Ward: 2013-LAR by NW Arkansas MSA
Article on writing with numbers
visualization-and-tableau-introduction-9-22
Put Dollar Signs on Labels
Insert Legends in Graphs
Filter Data in Graphs
Label the Horizontal Axis Properly
Math on Tableau – Percentages
Homework
Due 11:59 pm Monday Oct 31.
Examine Flat Files, Determine Discrepancies
#1: Resume Where We Left Off in Class
–Use the 2014 Flat Files —> THIS ONE FLAT FILES <—– and Calculate the Denial Rate for All Loans
–Compare the Denial Rates To the Earlier and Smaller Subset of Loans.
—WHY? Using Excel, Find Out Why Some Groups Now Have a Higher Rejection Rate with the larger dataset than with the smaller data. Was it because of refinancing? Was it because of farm loans? Run the different scenarios using Excel pivot tables.
WHY?
–Write up your findings in brief. Try to illustrate it in Tableau. Submit it in a blog post 11:59 pm Monday Oct 31.