Agenda for Monday, Oct. 8
–Context!
–Common Errors
Context #1
Add the Quick Facts for city population, demographics.
Little Rock: African American comprise 42 percent of Little Rock’s population. https://www.census.gov/quickfacts/fact/table/littlerockcityarkansas,US/PST045217
Add typical salary from Occupational Employment Statistics database for Arkansas
https://www.bls.gov/oes/current/oes_ar.htm
Common Errors – Math
Percent vs Percentage Point
At Lyon College, 67 percent of non-first-generation students paid back their loans within five years, while only 53 percent of first-generation students did the same, which results in a 14 percent POINT difference. The median debt for both types of students was the same though, at $12,000.
You mean “percentage point.” 14 percent of 67 is 9.4.
Steve Doig – MathCrib-Doig
Common Errors – AP Style on Numbers
AP Style on Numerals:
Numerals – AP Stylebook-2avrxtn
Common Error – Divi Library
Divi Builder. Do Not Save to Library.
Context #2: Build Charts for Context
First row: The overall median debt for Arkansas students; for men, for women.
Second row: The overall median debt for first generation students. And non-first generation
Third row: The overall statewide repayment rate, and the rate for men, for women
Fourth row: The overall median debt for white, black, asian, hispanic
Post on WordPress with the category Context
Research – Data Question
The Financial Aid department does not report loan repayment info to the Department of Education. “Once the students leave us we don’t track their information anymore,” he said.
Question: Look at data dictionary for source of this information. All 1,826 columns explained here.
https://collegescorecard.ed.gov/assets/FullDataDocumentation.pdf
https://collegescorecard.ed.gov/assets/CollegeScorecardDataDictionary.xlsx
Homework
#1: Read this report and compare to your work on context. Prepare to discuss it Wednesday
https://ticas.org/sites/default/files/pub_files/classof2016.pdf
#2: By 11:59 p.m. Tuesday, fix the issues with your charts and stories from Assignment #2. Post on WordPress, use the Context category for a tag
Hello!
Privacy Policy for School of Journalism Research on Twitter
We conduct our research in accordance to Institutional Review Board protocols. For details, see https://research.uark.edu/units/rscp/humans-as-subjects-in-research.php
Aug. 22 Day #2
Wednesday, Aug. 22 Class Agenda
Review Homework
WordPress
Work with crime data
New:
Office hours: Mondays 12:30 p.m-1:30 p.m., Thursdays, 2 p.m.-3 p.m. or by appointment
Review:
United Nations Population Dataset. Work With Nicar Coursepack:
Open sample dataset: UrbanPop.xls
Review four corners:
1. Make a copy
2. Freeze Panes
3. Four corners test
4. Check the math
Excel and the Black cross copy function
5. Sorting
6. Percentage Change:
(New Number-Old Number)/Old Number *100
UrbanPop Sorting and Answers
UrbanPop
1. Sorting
–Which urban agglomeration was the largest in 1950?
New York: 12.3 million
Which is expected to be the largest in 2030?
Tokyo: 37 million
2. Percentage Change
–Which had greatest rate of change between 1950-2015?
Cancun
16,894,000% 5,000 people to 845,000
Myanmar Nay Pyi Taw comes out as No 1 but it has an error message #DIV/0! There was no recorded population in 1950, so pick Cancun.
–Are any urban areas expected to lose population from 2010 to 2030?
48 cities from Riga to Asahikawa
–If so, how many and which one is expected to lose the most?
Latvia Riga -23.9%
Nigeria Lokoja 218.8%
Kitakyushu-Fukuoka M.M.A. loses the most on an absolute basis at 201,000
–Which United States urban area is expected to have the largest percent increase from 2015 to 2030?
The Woodlands, 66%
Least: Detroit, 6.8%
Cohen Reading:

Data Diary
What actions you took, commands you ran, thinking behind what you are doing.
FBI Crime Data
![]()
Exploring Rates and Ratios
Nicar Exercises: Rates_and_Ratios
- Data Dictionary: Uniform Crime Reporting, Read General Resources
– A Word About UCR Data
– UCR Statistics: Their Proper Use (pdf)
Gather in groups, read the data dictionary, produce questions
2) Gather Data For All Arkansas Cities, All Crimes
https://www.ucrdatatool.gov/Search/Crime/Local/OneYearofData.cfm
–Select all areas for Arkansas
–Select all crimes
–Download for 2014.
–Calculate crime rate per 100,000 people for 2014
Homework Due Saturday, 11:59 pm
Follow and complete the tasks in the Exericse 2 of the NICAR copurse pack, analyzing change in tuition. Use the University of Arkansas data from the College Navigator website.
Submit Excel spreadsheet and a brief two-paragraph discussion highlighting your findings on a WordPress blog. Answer these questions.
Analyze the estimated tuition, fees and living expenses data for students to help you answer the questions below.
1) How much would an in-state student expect to pay for the 2017-2018 school year?
2) How much would an out-of-state student expect to pay for the 2017-2018 school year?
3) How much more did out-of-students pay in 2017-2018 than in-state students?
4) Which category increased the most from the 2014-2015 to the 2017-2018 school years? Raw change? Percent
change?
5) Write a lead for a story based on your analysis.
6) What other information and/or sources would help you finish this story?
Aug. 20, Day #1
Class Agenda
Syllabus / Schedule
Email to students.
Basics of data analysis.
Intro Excel
Refresher Excel exercise
Previous Class Projects:
Spring 2018: Low-Wage Workers
https://wordpressua.uark.edu/workingandpoor/

Andrew Epperson, center, and Katie Serrano discuss their reporting and data analysis on low-wage workers with KUAF News Director Kyle Kellams. The students’ work was broadcast on KUAF in Fayetteville and KUAR in Little Rock and their multimedia work was published on the websites of KUAF, KUAR as well as KASU Jonesboro and KBSA El Dorado.
Fall 2017: Veterans Administration Health Care
https://www.linkedin.com/pulse/student-journalists-examine-va-health-rob-wells/?published=t
Fall 2016: Racial Disparities in Mortgage Lending
http://arkansaspublicmedia.org/post/housing-loans-difficult-most-northwest-arkansas-minorities
News coverage of project:
http://arkansaspublicmedia.org/post/ua-database-journalism-digs-home-mortgages-race-discoversits-complicated
Segment on KUAF “Ozarks at Large”:
http://news.uark.edu/articles/37691/lemke-journalism-students-investigate-mortgage-lending-disparities-in-northwest-arkansas
Basics of Data Analysis
Reliability: How sure are we that we got the right answer? That we’ve done everything correctly?
Replicability: If we had to do it all again, would we get the same answer? If someone else did it, would they?
Transparency: If our results are challenged, can we show exactly what we’ve done to defend it?
–Matt Waite
________________________________________________
Refresher: Basic Excel
NICAR Coursepack: Basics and Sorting in Excel
Open sample dataset: citybudget.xls
1. Make a copy
2. Four corners test
3. Check the math
4. Sorting
5. Percentage Change
Formula: (New number-Old Number)/Old Number * 100 and use % symbol
Background and Help:
Lynda.com tutorial videos on Excel.
Homework
- Readings
Cohen, Sarah. Numbers in the Newsroom: Using Math and Statistics in News. 2nd ed. Columbia, Mo.: Investigative Reporters & Editors Inc., 2014. Figuring Rates – Numbers in Newsroom
–Write two questions or observations about each of the readings.
2. Answer questions in the NICAR coursepack, UrbanPop Data
Sorting:
–Which urban agglomeration was the largest in 1950?
–Which is expected to be the largest in 2030?
Percentage Change:
–Which had greatest rate of change between 1950-2015?
–Are any urban areas expected to lose population from 2010 to 2030?
–If so, how many and which one is expected to lose the most?
–Which United States urban area is expected to have the largest percent increase from 2015 to 2030?
Answers due 11:59 pm Tuesday, Aug 21. Email to rswells@uark.edu
Wednesday, Aug. 22 Class Agenda
Review Homework
WordPress
Tableau
Work with student loan data
In Class Data Exercise
Excel: NICAR pack
Examine Student Loan Data: Tuition costs at Arkansas colleges and universities.
What does this mean? Look at the data dictionary.
—
Tableau Software
Thank you for your interest in the Tableau for Teaching program. Below is a website (landing page link) for your upcoming class. Each student should go to the landing page to download Tableau Desktop and enter the product key noted below. This key will allow your entire class to activate Tableau Desktop for the duration of the course.
Please forward these instructions to your students:
- Download the latest version of Tableau Desktop here
- Click on the link above and select Get Started. On the form, enter your school email address for Business E-mail and enter the name of your school for Organization.
- Activate with your product key: TCN8-F401-A980-11F5-79E7
- Already have a copy of Tableau Desktop installed? Update your license in the application: Help menu -> Manage Product Keys
Are your students new to Tableau? Share our free Data Analytics for University Students guide to help them get started.
Students can continue using Tableau after the class is over by individually requesting their own one-year license through the Tableau for Students program here
Need help? Find answers to frequently asked questions here.
Best,
Academic Programs Team
Tableau Software
tft@tableau.com
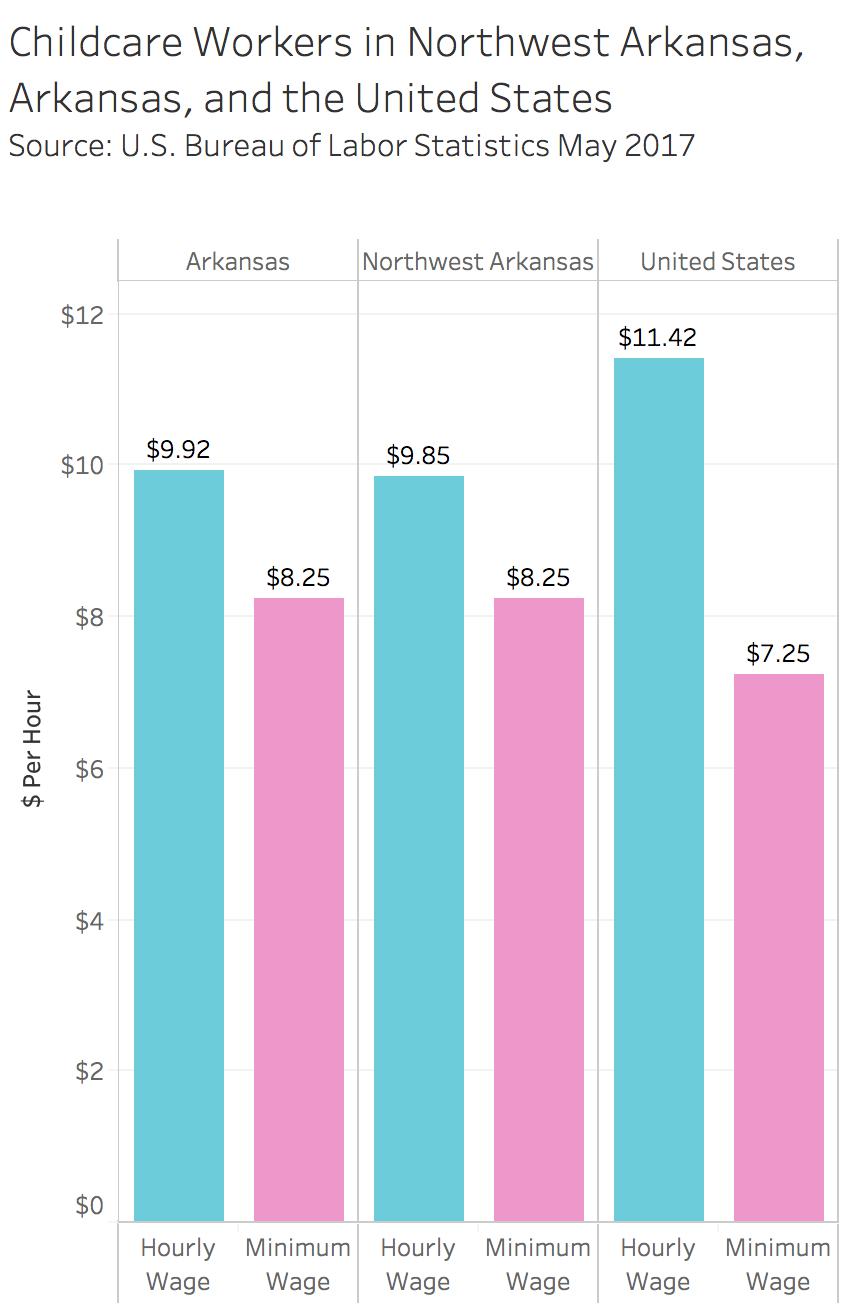
child care workers – elisabeth butler
Student Loan Readings

Read Up on Student Loans
Welcome to the Digital News Lab. Here is some reading to prepare you for our reporting on student debt burdens facing recent graduates. Read the following articles and set up a Google News Alert for student loans. That will get you rolling into the Fall.
Contact me at rswells@uark.edu or @rwells1961 if you have questions. Thanks, Dr. Wells (updated 8/11)
$1 Trillion Debt Problem
https://www.marketwatch.com/story/happy-birthday-americas-1-trillion-dollar-student-debt-problem-2018-04-25
You could recoup the cost of college in under 3 years if you’re willing to do one thing
https://www.cnbc.com/2018/05/14/how-to-recoup-the-cost-of-college-in-less-than-3-years.html
Final Class – May 3, 2018

Editing Punch List
Everyone: Fix your graphics. They are too tall and skinny. They need to be more box like to fit this layout.
Get rid of the vertical X-axis labels.
Aubry Tucker
Mary Kerr Winters
Andrew Epperson
Graphic for Quintero story?
Ann Johnson
Audio – Joy Senn
Katie Serrano
Renee Smith article.
Alvin Davis -What company did he work for?
Optional: Graphic for Davis
Elisabeth Butler
Attached is a spreadsheet for the fact checking process.
Check the occupational wages against this list: OES state_M2017_dl-vx7ovu
Editing Notes from Nicole, WordPress Team
Rob Wells Class Documentation-217h1ew
Solution to picture height-1e55r0f: max-height: 500px;
Renee Smith, Burger King Employee. Katie Serrano
When Renee Smith, 43, comes into work at Burger King every day, she takes pride in working her way up from getting paid $8.50 an hour to $11 an hour.
As a mother of four children and one grandchild all under the same roof, Smith said her and her husband have struggled to make ends meet for years.
“I’ve been working here for four years,” she said. “When you’re in a place long enough, you get comfortable and it’s hard to leave.”

Smith’s husband is a farmer, and she said they have to rely on their oldest daughter to help support them.
“We are surviving,” she said. We are nowhere near where I want to be.”
When it comes to budgeting, Smith and her family focus on putting food on the table.
“I wish we got coupons or something working on here, that would be a life saver,” she said. “But food is what we got to use our paychecks for first. I’ll get my hair and nails done when I can to look nice or splurge on the girls and buy them a new pair of shoes, but that’s about it.”
Class 14, April 26
Fact Check
Attached is a spreadsheet for the fact checking process. Please put the name, email and phone number of the people you spoke to on this list. I will be contacting them and sending a few quotes to make sure everything is ok. I do this on major projects and rarely have any issues – the people we interview really appreciate the follow-up.
Check the occupational wages against this list:
Editing Punch List
Mary Kerr Winters
Modify this to make it just an interactive Tableau map that we will use in the gallery.
–Edit Cathy Lee audio in Premier to remove background noise
Andrew Epperson
Esmeralda Jaimes – fix edits, photo. rewrite
Quintero
Ann Johnson
Katie Serrano
1) Dana Ralpho. Split this into a separate post.
–Wage she earns at Wendy’s
–Audio clip
–More detail about her situation. This story is very brief and incomplete
2) Renee Smith.
3) Davis.
4) Lara
Elisabeth Butler
Editing Notes from Nicole, WordPress Team
Rob Wells Class Documentation-217h1ew
Solution to picture height-1e55r0f
The production site:
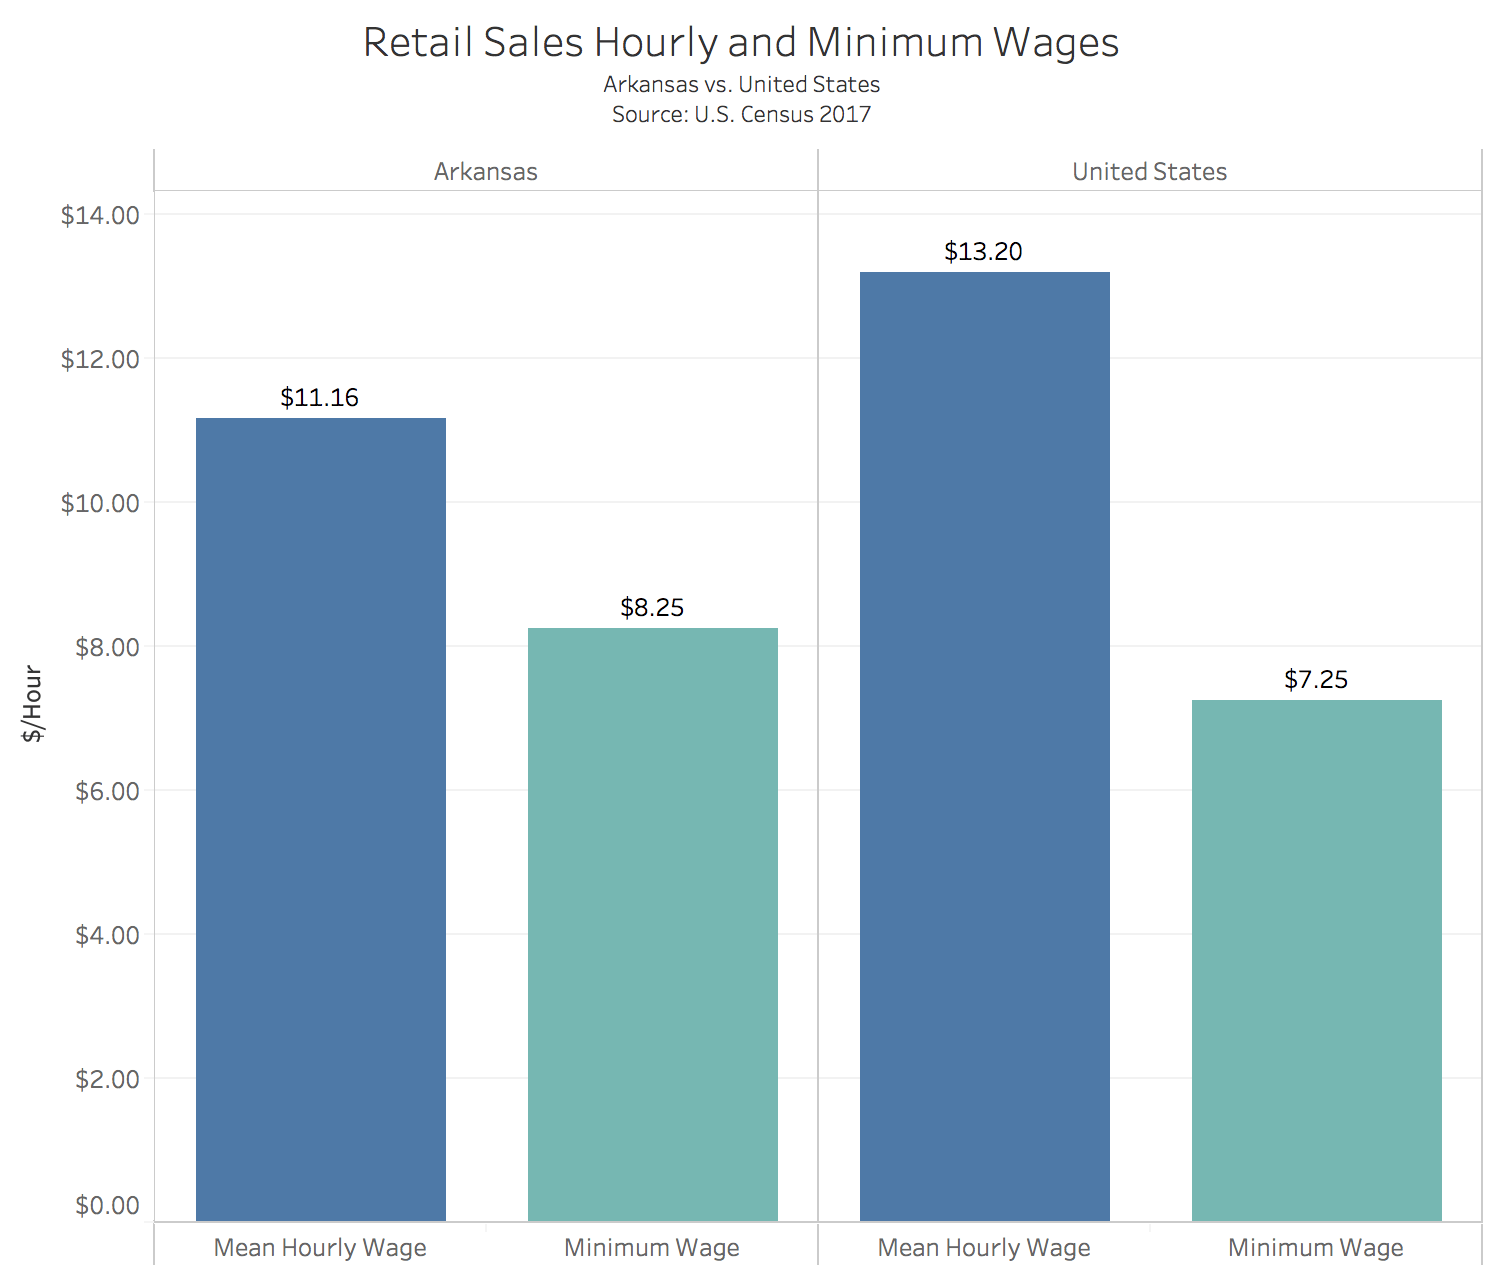
Retail Sales Wages Graphic – Winters