Agenda for Monday, Oct. 8
–Context!
–Common Errors
Context #1
Add the Quick Facts for city population, demographics.
Little Rock: African American comprise 42 percent of Little Rock’s population. https://www.census.gov/quickfacts/fact/table/littlerockcityarkansas,US/PST045217
Add typical salary from Occupational Employment Statistics database for Arkansas
https://www.bls.gov/oes/current/oes_ar.htm
Common Errors – Math
Percent vs Percentage Point
At Lyon College, 67 percent of non-first-generation students paid back their loans within five years, while only 53 percent of first-generation students did the same, which results in a 14 percent POINT difference. The median debt for both types of students was the same though, at $12,000.
You mean “percentage point.” 14 percent of 67 is 9.4.
Steve Doig – MathCrib-Doig
Common Errors – AP Style on Numbers
AP Style on Numerals:
Numerals – AP Stylebook-2avrxtn
Common Error – Divi Library
Divi Builder. Do Not Save to Library.
Context #2: Build Charts for Context
First row: The overall median debt for Arkansas students; for men, for women.
Second row: The overall median debt for first generation students. And non-first generation
Third row: The overall statewide repayment rate, and the rate for men, for women
Fourth row: The overall median debt for white, black, asian, hispanic
Post on WordPress with the category Context
Research – Data Question
The Financial Aid department does not report loan repayment info to the Department of Education. “Once the students leave us we don’t track their information anymore,” he said.
Question: Look at data dictionary for source of this information. All 1,826 columns explained here.
https://collegescorecard.ed.gov/assets/FullDataDocumentation.pdf
https://collegescorecard.ed.gov/assets/CollegeScorecardDataDictionary.xlsx
Homework
#1: Read this report and compare to your work on context. Prepare to discuss it Wednesday
https://ticas.org/sites/default/files/pub_files/classof2016.pdf
#2: By 11:59 p.m. Tuesday, fix the issues with your charts and stories from Assignment #2. Post on WordPress, use the Context category for a tag
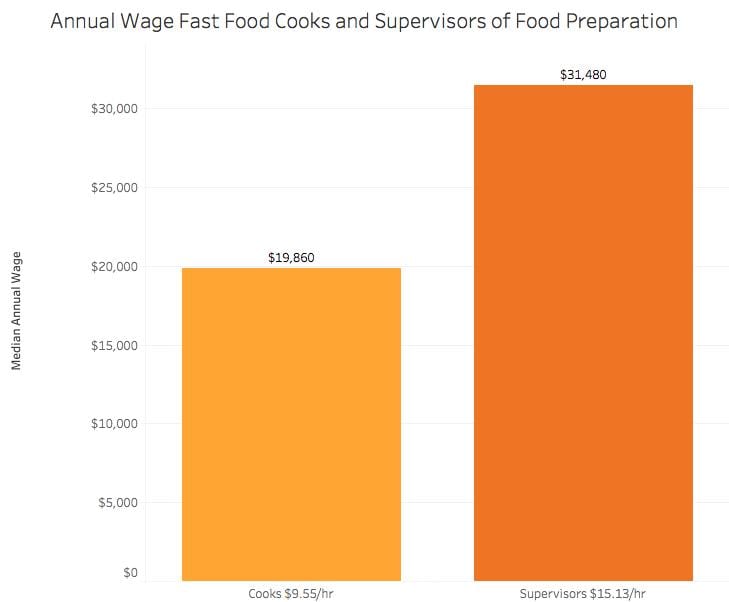
Sherrod Bryan, Zaxby’s. By Aubry Tucker

Fayetteville, AR–Sherrod Bryan, 22 is an Assistant Manager at Zaxby’s and said he, “has never had a bad customer.” Bryan shares a living space with not only his fiance, but also his sister and her girlfriend. He makes $11.50 an hour and has been a member of the Zaxby’s team since 2014 when he was in high school.
In Bryan’s time working at Zaxby’s he has even experienced pay increases that occurred due to the minimum wage for Arkansas being raised. He explained that when he started his job at Zaxby’s he was more focused on, “doing school, hanging out with friends, and playing video gaming.” However, he said one of the reasons he’s happy to have the opportunity to manage at Zaxby’s because he was able to move up at his own pace. There is a considerable difference between a management position, and the cooks or the register workers. Bryan has experienced both of these wage levels as he moved through the ranks. It’s important to consider Bryan is making $11.50 an hour which is less than the median wage of $15.13 estimated for his position in Northwest Arkansas, according to the Bureau of Labor Statistics. There is evident impact in the addition of a few more dollars an hour adds to an annual income, and furthermore an individual’s quality of life.
Bryan said as manager he is in a very trusted position, “you have to have a lot of integrity being the manager, cause you handle money all day.” As an Assistant Manager he is often responsible for 2 different locations throughout the week, where his responsibilities vary between location. He said he tries to keep the dynamic between him and his coworkers cohesive, “ The way I like to try to manage is to keep it more family and fun, than business and money,” he said, because that’s the best way to get work done and make the best food they can.
Bryan said it was an easy job for him to have in high school, while still being able to focus on his life as a student and his personal relationships. Now that he is full time, and trusted with more responsibilities it can be difficult to make time for his friends, “As far as just generally having a social life, it’s not as hard as some would think it is…I think you just gotta set time aside.” Bryan said.
In his free time Bryan said he enjoys doing parkour, reading, playing video games, and singing. He sang a bit of a song from one of his favorite movies, “The Nightmare Before Christmas.”
Aside from those interests Bryan said he is passionate about cooking and that it is not strange for him to attempt dishes he’s seen on The Food Network. He and his fiancé try to make their food at home to save their extra cash. Bryan said most of the money he makes seems to go to his cable bill, and he admitted he was talked into a fancier package than he had intended on getting initially. Bryan’s cable bill comes in at about $200 a month. He expressed that rent is also costly but is significantly less being split between four people. Bryan and his fiancé have been engaged for about a year and a half, but he said they haven’t set a date for the big day just yet.
Tableau Public Assignment – Andrew Epperson
My Tableau Workbook EDITED – Mary Kerr Winters
Edited with interactive filter.
Class 9: March 15, 2018
Agenda:
-Review Tableau Assignment and Interactive Graphics
-Review Updated Stories
-Hello World: Coding Time with R Studio
Tableau Interactive Graphics
Dashboards with Poverty Data.
Sizing and Formatting. Navigation from Dashboard to Actual Graphic.
Simplicity in Design for Dashboard,
Space for Central Element.
Filters: Basic Filters and Filter as Sheet
Basic Filter: Applies to One Worksheet
–Click upper righthand menu on graphic, see Filters, select the appropriate data source. Here it would be total incomes under $25,000.
–Filter is created and placed at the bottom of graphic. You can format and move the filter.
–Drag by tab in upper center of filter object. Move it to the top of the filtered graphic.
“Super Filter”: Add a Filter to Control All Cities on Worksheet
Filters on Dashboards
When we click through a filter, we see that by default, it only applies to the view it came
out with. We can make this filter apply to the entire dashboard.
–Click on the filter (down triangle icon), open the menu.
–Apply to Worksheets, select “all related data sources”
Now when we make a selection, it applies to the whole dashboard
Similarly, we can make a view act as a filter for the dashboard. Click on the view to bring
up the header bar, and click the filter icon. Now if we select a header such as Second
Class, all the relevant views are filtered.
Exercise: Format Workbook for A Phone
A majority of our readers will view these stories on their phones. For the Fall 2017 Veterans Health Care project, some 70 percent of the readership was on a mobile device. Schleuss said the Los Angeles Times receives about 55 percent of its traffic on mobile devices.
Let’s format this workbook for mobile. The design choices will be radically different.
–Duplicate your workbook
–Design it with the mobile template on the left: See Upper Left Tab: Dashboard: Device Preview. Switch to Phone
–Before doing any radical surgery to your graphics, consider duplicating them and bringing in the new versions into the mobile template.
Introducing R Studio
![]()
Open R Studio on Your Desktop.
Download this tutorial and open it in R Studio
Assignment #3:
Advanced Reporting & Data Analysis
Jour 405V Sec. 7, Spring 2018
Assignment #3: Interview and Data
Due 11:59 p.m. Wednesday, March 28. Post on WordPress
Write a 500-word news story based on an interview with a person classified as working poor in Northwest Arkansas.
Illustrate this post with the following:
-
- A photo of your interview subject
- A chart that illustrates details about this person’s occupation. Draw this from the BLS Occupational Employment Statistics database
- Produce a 30-second – maximum 2 minute audio clip from your interview. Introduce your subject and the context of the interview, like you would hear on a podcast. Embed this in the blog post.
Additional Material for Graduate Students:
A second interview, with a photo and brief audio clip, as described above. No graphics needed for the second interview.
Everyone:
Post the interview, graphic and photo in a single blog post, weaving them together to tell the story of your interview subject. Follow a news story format and follow AP style. This is due 11:59 p.m. Wednesday, March 28. Post on WordPress
Johnson Assign#2 edited
Solid photo
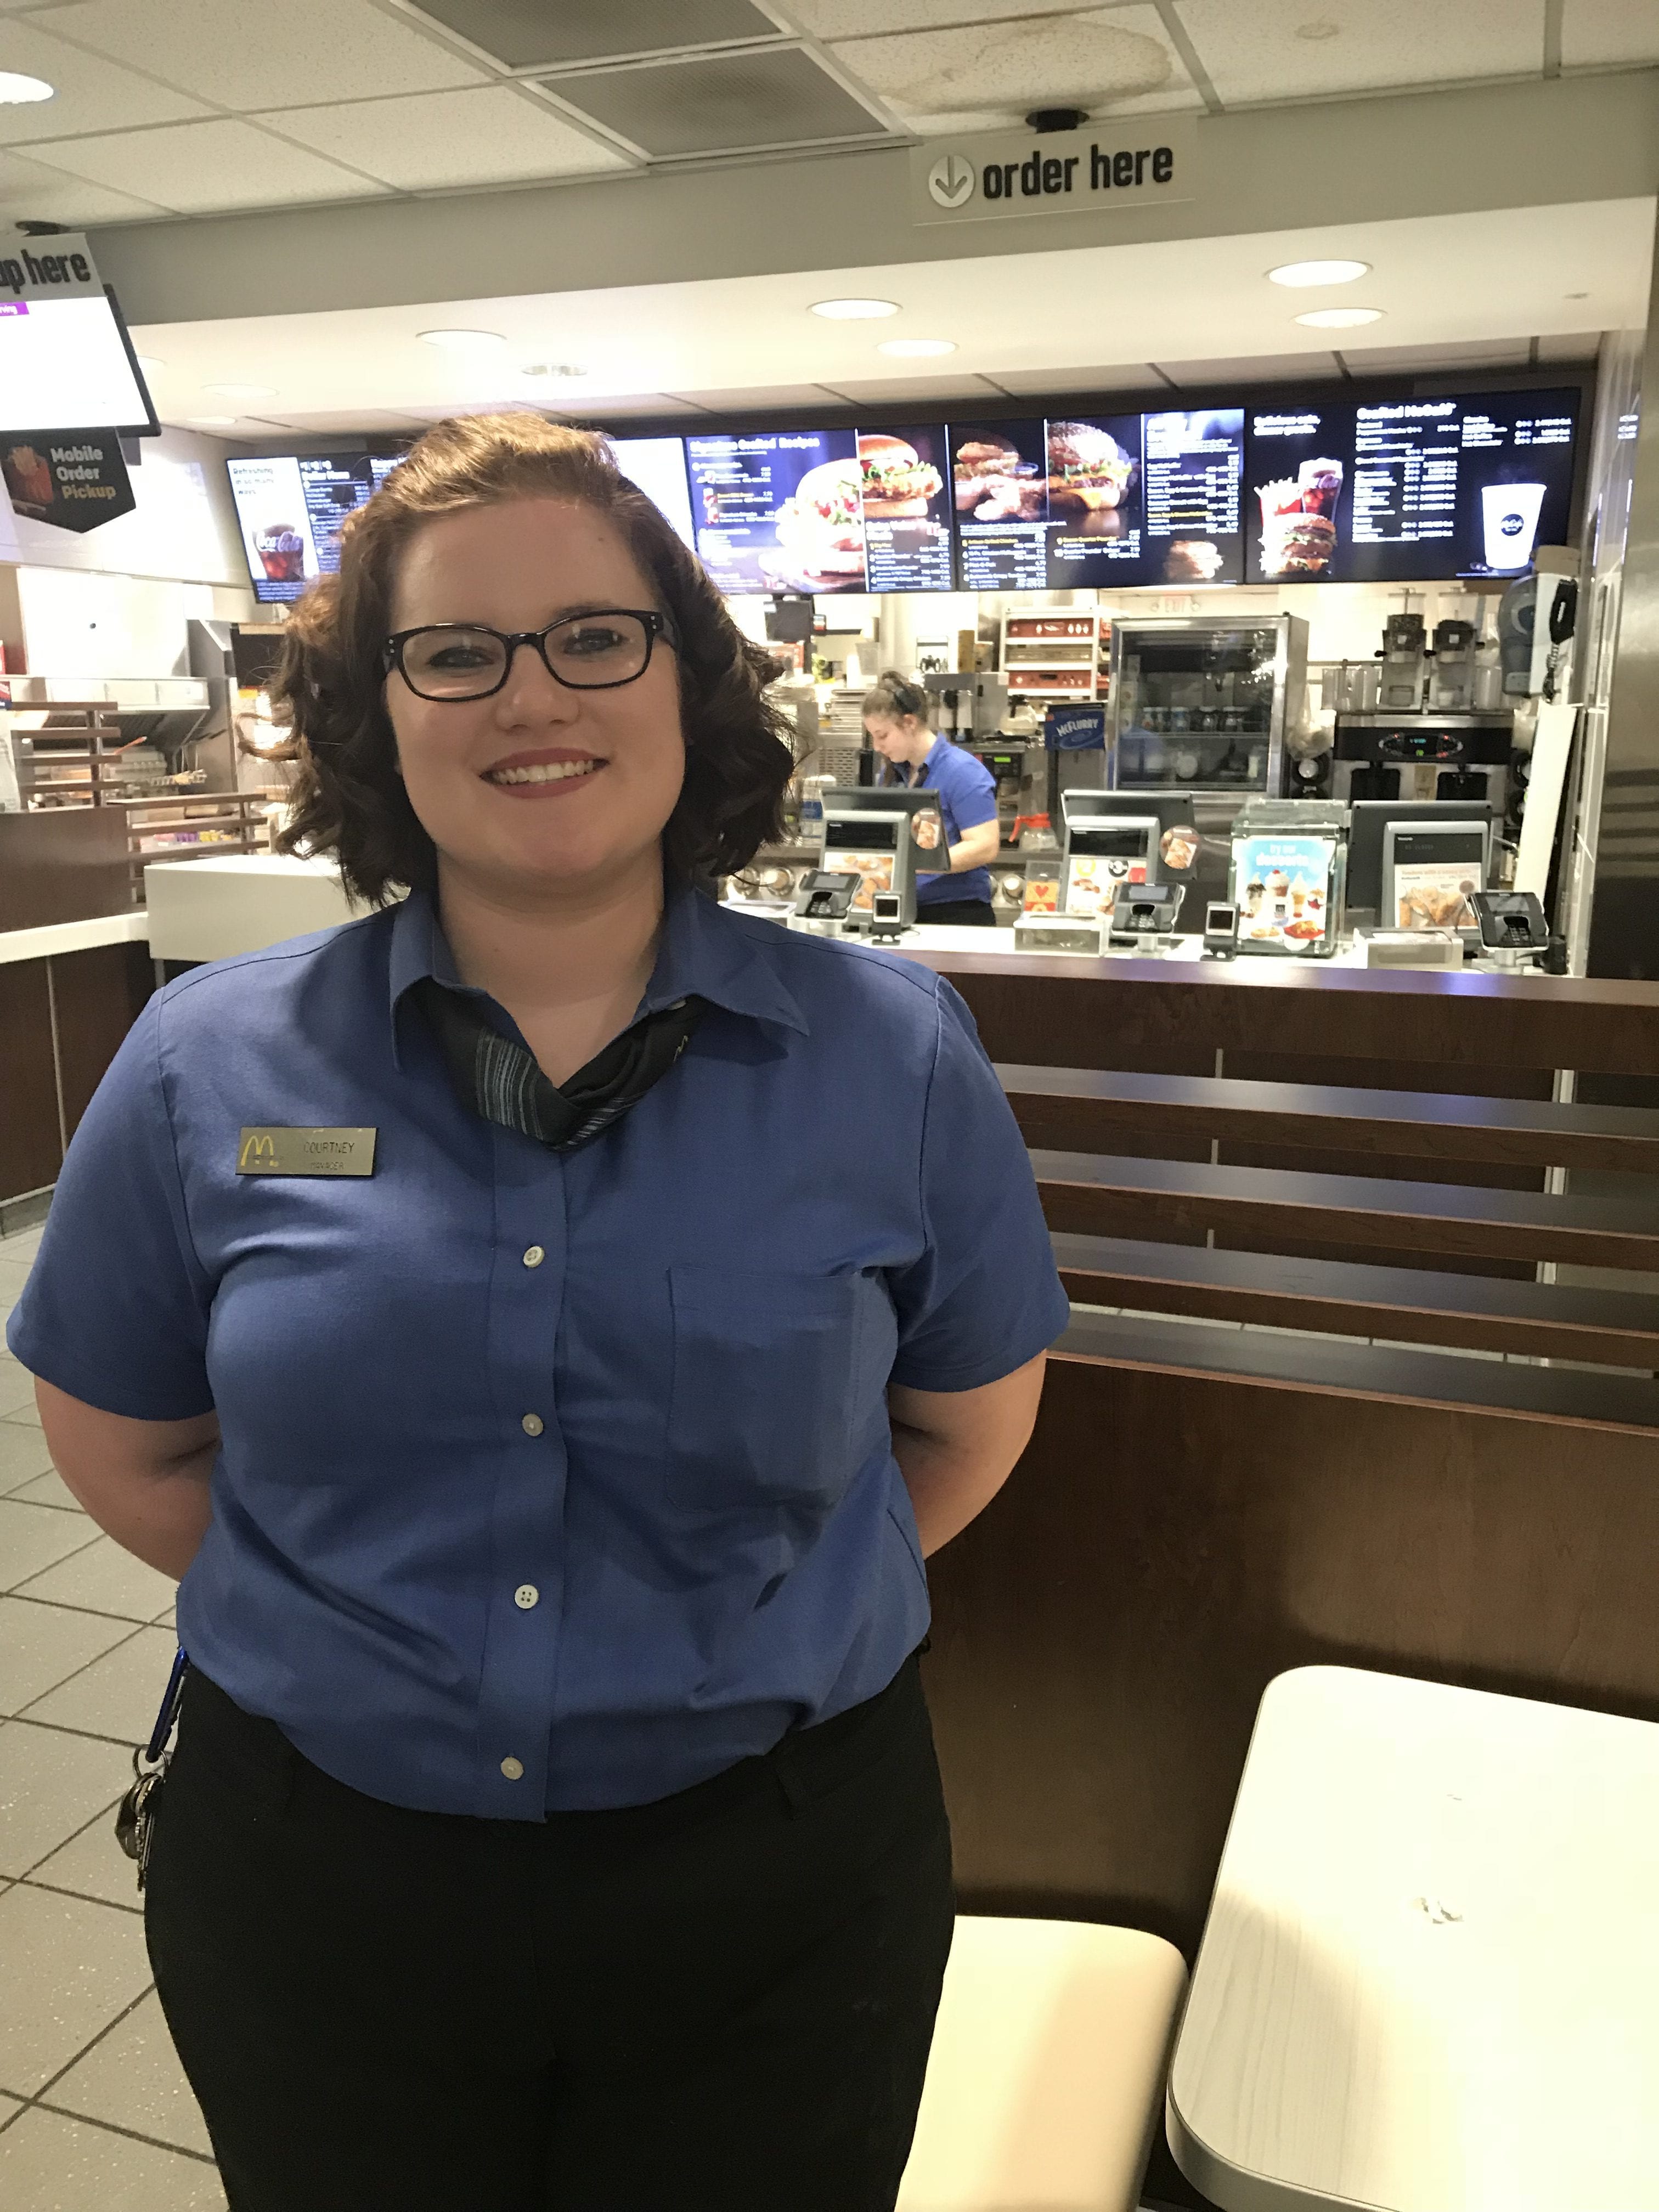
FAYETTEVILLE, Ark. – Courtney Boyd, an 18-year-old manager (she is 18 years old and is managing a McDonalds? double check the age) of the McDonalds on Martin Luther King Blvd, works eight to ten hour shifts in order to make her dream of finishing culinary school (we should work with the contrast of McDonalds and culinary school) come true. While being in charge of keeping McDonalds running like a well-oiled machine, she is also consciously invested in the well being of her coworkers and customers. “We are a tight knit group, like a family,” she said.
Boyd makes $10 an hour. She has worked at McDonalds for the past five years (this doesn’t make sense. That means she started worked at age 13) and after reaching the age of 18, she was promoted to a managing position. “I am a manager that has split shifts. Sometimes I work overnight, sometimes during the day, sometimes in the morning. I get thrown in because I have open availability,” Boyd said. At the time of this interview she was working at 1:30 am.
Courtney Boyd said that when one begins work at McDonalds as a crew member they make an hourly wage of $7.50 (this conflicts with the Arkansas minimum wage of $8.50) and then can work their way up to a maximum of $9.00 an hour. When Boyd was promoted to a managing position she began making the minimum hourly wage for a manager which is $10. Managers and crew members are able to be promoted yearly.
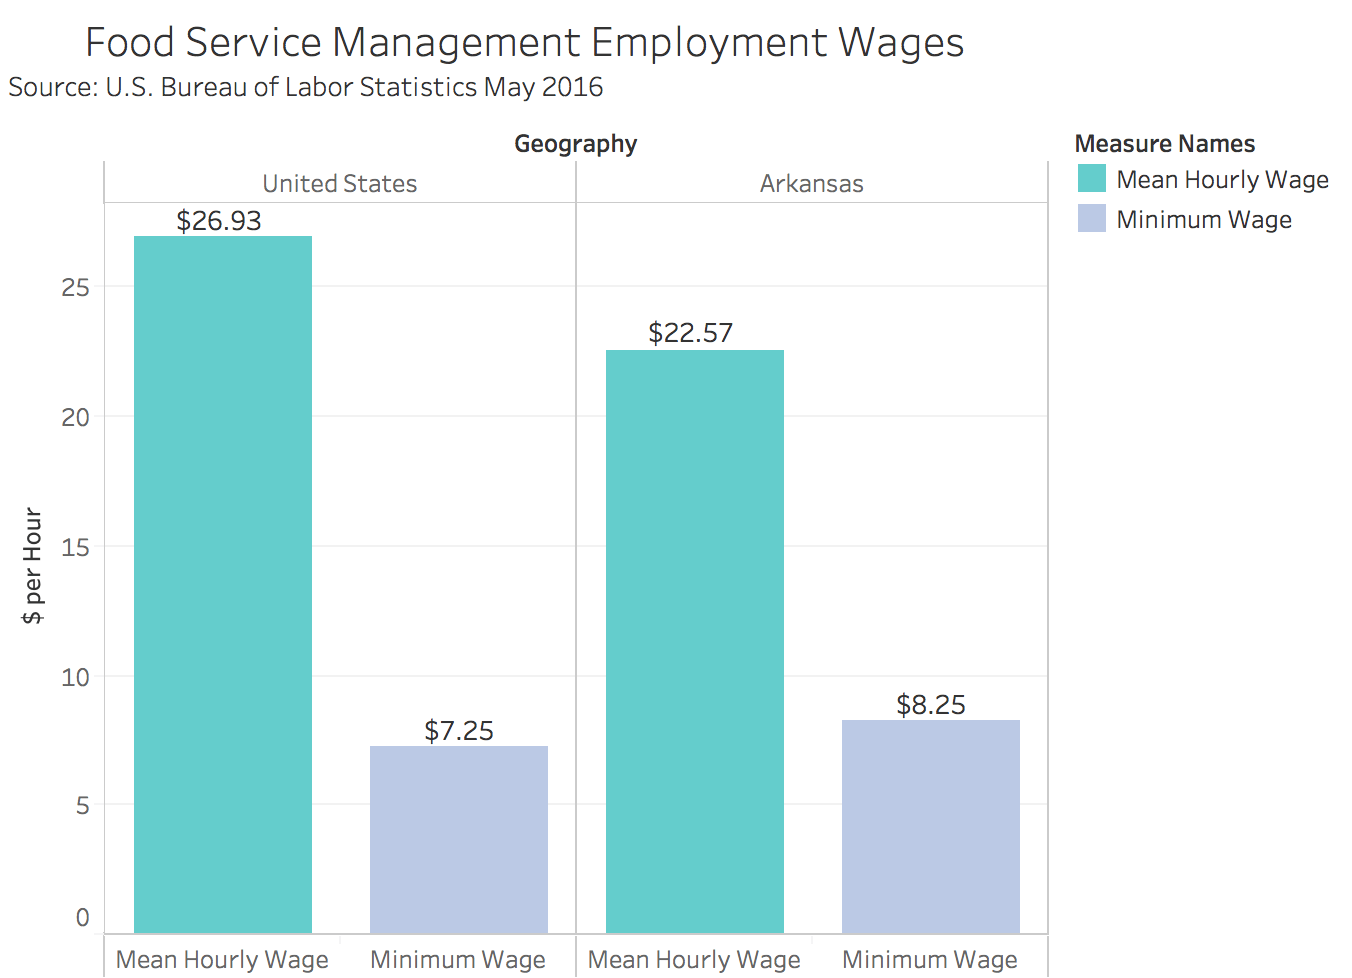
Comment on graphic below:
–Arkansas minimum wage is $8.50. Update.
–Other data is accurate
Boyd was undoubtedly grateful for her parents supporting her dreams. They fund 90 percent of her tuition at North West Arkansas Community College for culinary school. Boyd contributes the funds for 10 percent of her tuition to help out. “I am getting free rent at their house,” Boyd said that this is allowing her to save up for her own house.
When asked if she felt like she had to sacrifice anything because she was working so often and while also being a student at the same time, Boyd said that she absolutely feels this way. (revise sentence- awkward. state directly and in the affirmative: “Boyd said she has to sacrifice….”) She said that the biggest sacrifice she makes is not having friends because she is working full–time and even sometimes overtime in addition to the two five-hour classes that she is taking for culinary school. “I also have to sacrifice time with my family,” Boyd said. Boyd will go to her 11 a.m. culinary classes twice a week after her 5pm to 2am (AP style on times) shift at McDonalds.
I asked Boyd if it was worth it working such long and inconvenient hours at this age. “At the pay I get, no. But it’s McDonalds, so I definitely could go somewhere else. I choose not to because they are easy with my hours and if I needed a day off they can usually give me the day off then and there and I don’t get any consequences,” she said.
Boyd informs me that the people that live below the poverty line are the staff workers that work nighttime shifts. “I believe that people that live below the poverty line are the people that work the hardest. They really want to keep their job and succeed,” Boyd said. Boyd said that McDonald’s holds a manager class once a month in order to provide the learning opportunity for staff workers that want to move up to managing positions. This class is helpful because in addition to positive reinforcement to the hard workers, it provides tips to maintaining good hygiene and acting as a leader in a fast paced work place.
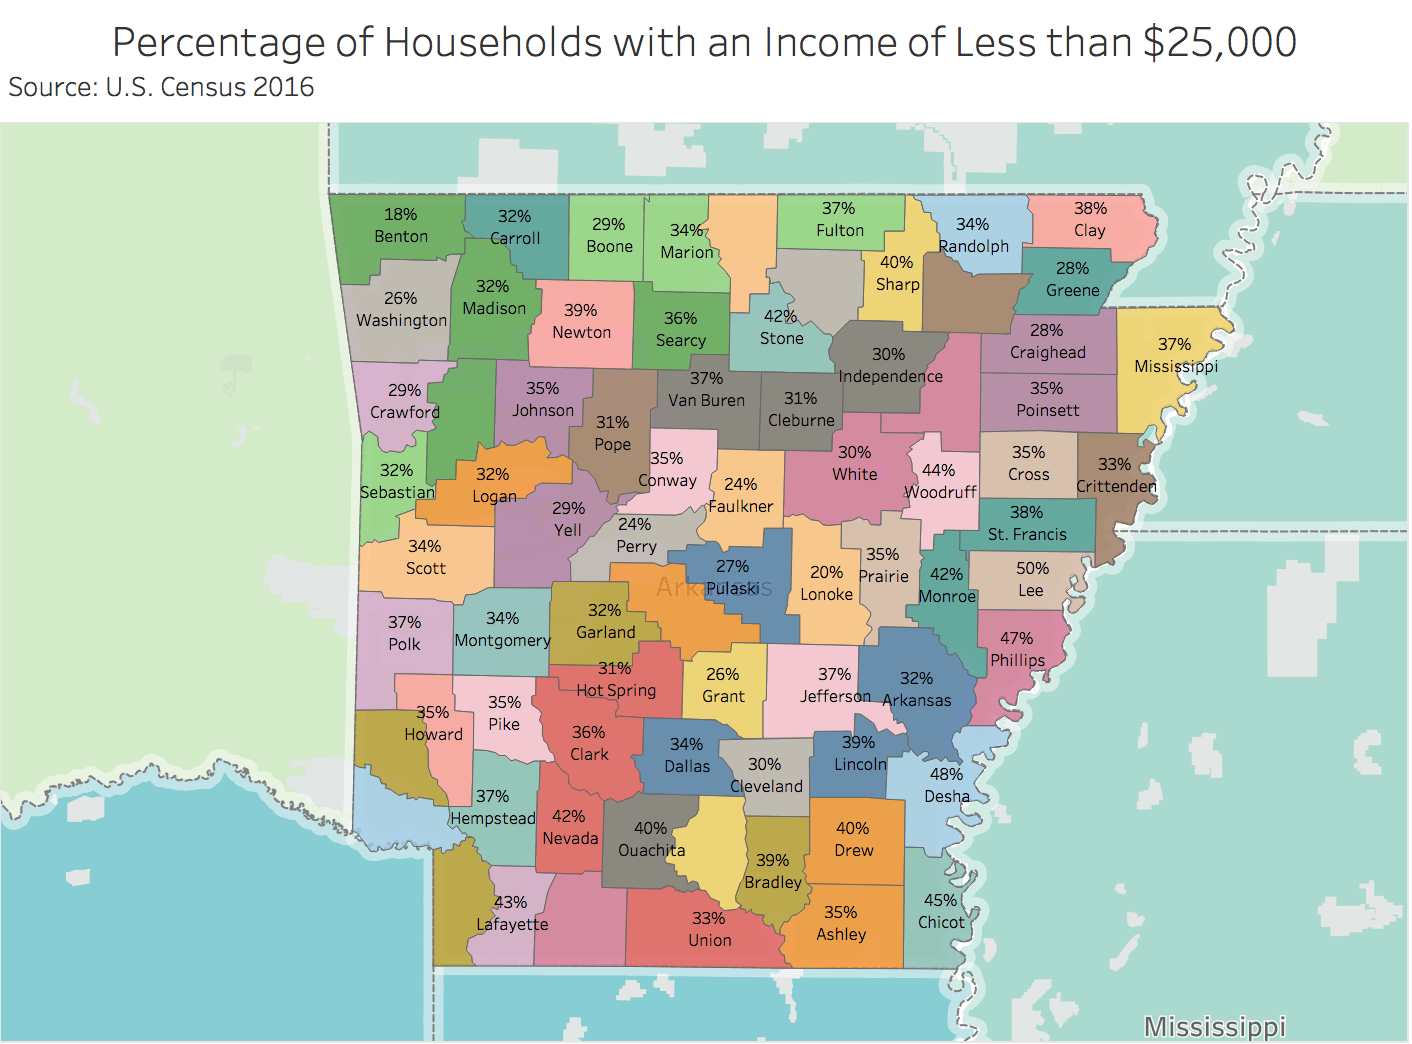
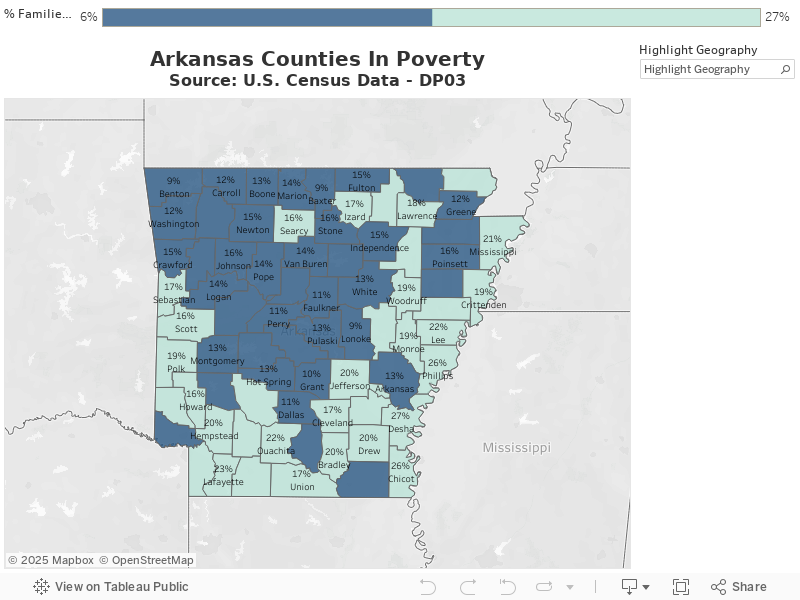
Comments on graphic below:
–This is a good looking map. I don’t understand the color scheme, however. It seems random. We need to use colors to highlight and explain the data. This is not a numerically consistent color scheme (29% are different colors, for example).
My Tableau Workbook – Mary Kerr Winters
Online Class Exercise Aubry Tucker
https://public.tableau.com/profile/aubry.tucker#!/vizhome/OnlineClassExercise/Dashboard1?publish=yes
https://public.tableau.com/shared/WJG45KHTB?:display_count=yes
Tableau Public Assignment for March 9th- Ann Claire Johnson
My Tableau Workbook- Ann Claire Johnson
Dashboard Assignment
https://public.tableau.com/views/PovertyAssignment-Publish/Map?:embed=y&:display_count=yes&publish=yes