Agenda for Monday, Oct. 8
–Context!
–Common Errors
Context #1
Add the Quick Facts for city population, demographics.
Little Rock: African American comprise 42 percent of Little Rock’s population. https://www.census.gov/quickfacts/fact/table/littlerockcityarkansas,US/PST045217
Add typical salary from Occupational Employment Statistics database for Arkansas
https://www.bls.gov/oes/current/oes_ar.htm
Common Errors – Math
Percent vs Percentage Point
At Lyon College, 67 percent of non-first-generation students paid back their loans within five years, while only 53 percent of first-generation students did the same, which results in a 14 percent POINT difference. The median debt for both types of students was the same though, at $12,000.
You mean “percentage point.” 14 percent of 67 is 9.4.
Steve Doig – MathCrib-Doig
Common Errors – AP Style on Numbers
AP Style on Numerals:
Numerals – AP Stylebook-2avrxtn
Common Error – Divi Library
Divi Builder. Do Not Save to Library.
Context #2: Build Charts for Context
First row: The overall median debt for Arkansas students; for men, for women.
Second row: The overall median debt for first generation students. And non-first generation
Third row: The overall statewide repayment rate, and the rate for men, for women
Fourth row: The overall median debt for white, black, asian, hispanic
Post on WordPress with the category Context
Research – Data Question
The Financial Aid department does not report loan repayment info to the Department of Education. “Once the students leave us we don’t track their information anymore,” he said.
Question: Look at data dictionary for source of this information. All 1,826 columns explained here.
https://collegescorecard.ed.gov/assets/FullDataDocumentation.pdf
https://collegescorecard.ed.gov/assets/CollegeScorecardDataDictionary.xlsx
Homework
#1: Read this report and compare to your work on context. Prepare to discuss it Wednesday
https://ticas.org/sites/default/files/pub_files/classof2016.pdf
#2: By 11:59 p.m. Tuesday, fix the issues with your charts and stories from Assignment #2. Post on WordPress, use the Context category for a tag
Class 3 Feb 1
Agenda for Thursday, Feb. 1
Data: Continue Working With Census Data.
–Task #1: Use Tableau to Visualize Census Data from Homework.
–Task #2: Visualize Poverty and Female Households from Census Data
–Task #3: Download Census Data with Demographic Information.
6:30 pm Guest speaker by Skype: Bobby Ampezzan, Arkansas Public Media.
Examine Occupations and Salaries in OES Database
Reading Discussion: Nickel and Dimed. The Holdouts.
-Low-wage worker you intend to interview for the class
Task #1: Use Tableau to Visualize Census Data from Homework.
Here’s a start:

–Download and clean the data: US Ark Counties Poverty ACS_16_5YR_DP03_with_ann-1w6iwss
We have a lot of data in this spreadsheet. Let’s simplify things. We will visualize just one column- Column J –:
“Percent; INCOME AND BENEFITS (IN 2016 INFLATION-ADJUSTED DOLLARS) – Total households – $15,000 to $24,999”
–Copy the “Edited Poverty” tab and rename it Min Wage Only
–Delete all of the columns except for the Percent; INCOME AND BENEFITS (IN 2016 INFLATION-ADJUSTED DOLLARS) – Total households – $15,000 to $24,999″
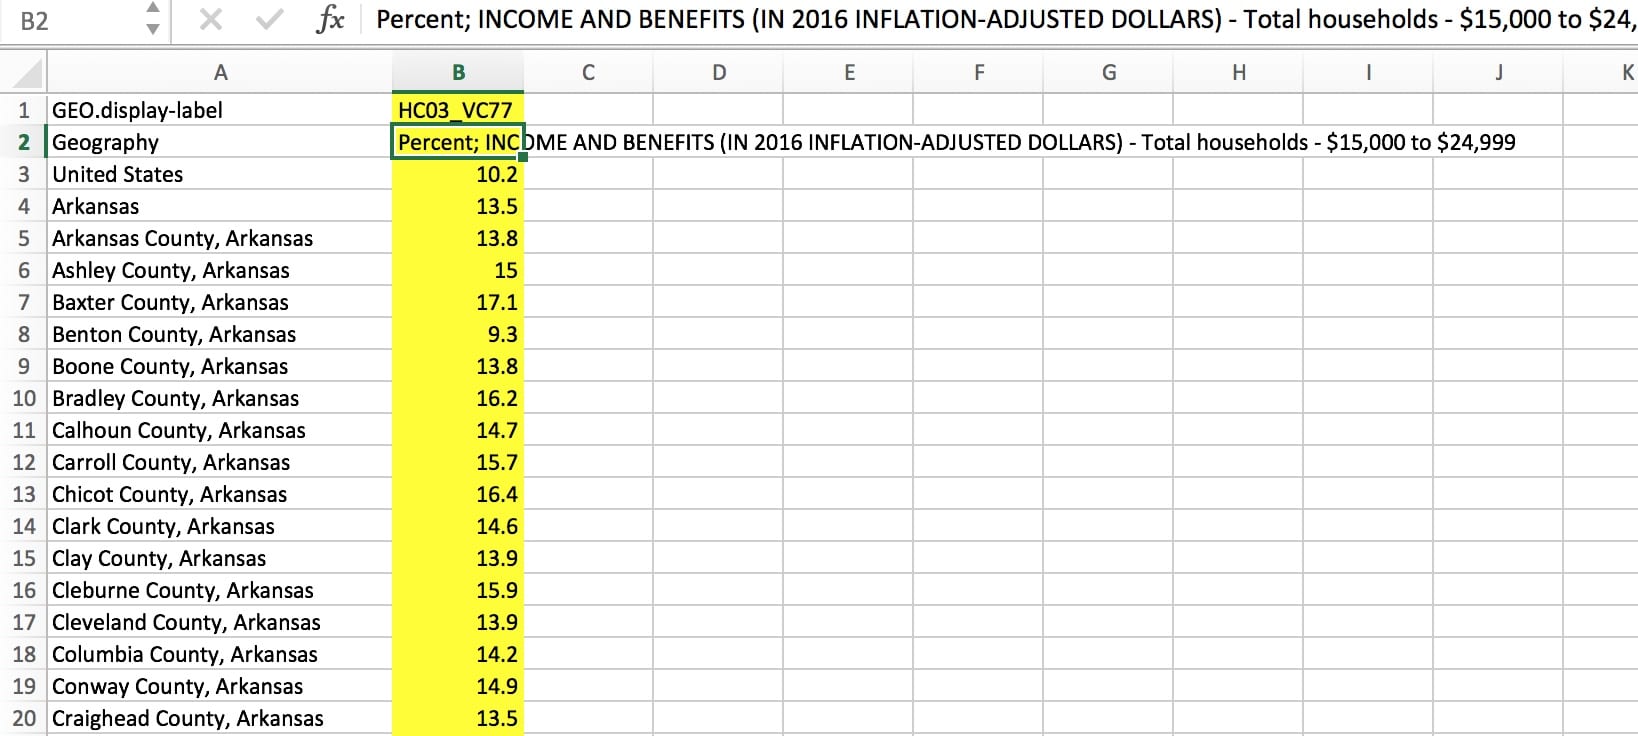
–Fix the column headings so it plays nice with Tableau. Delete the Row 1 “GEO.display-label…”
–Simplify your new column B: % Households – $15k-$25k
–Save, backup etc and open Tableau.
–Import your data
–Open new tab
–Geography to Columns. % Households $15k- $25k to rows
–Sort by largest-smallest
–Filter by Geography – drag Geography to Filter. Filter to keep the following:
Arkansas, Benton,Carroll, Crawford, Madison, Sebastian, United States, Washington
Formatting. This is the standard formatting you will apply to all of your charts in some fashion. We are simplifying and clearly marking the labels
–Drag to Label in Marks box: % Households $15k- $25k to rows
–Format Label to % – Format | Pane | Default | Numbers | Numbers: Custom | 1 decimal. % as suffix.
–Format Y Axis to %. – Format | Axis | Scale | Numbers | Number: Custom | no decimal, % as suffix.
–Color the bars. Drag to colors in Marks box: % Households $15k- $25k to rows. Edit colors to blue – red scale, reverse colors so red = highest.
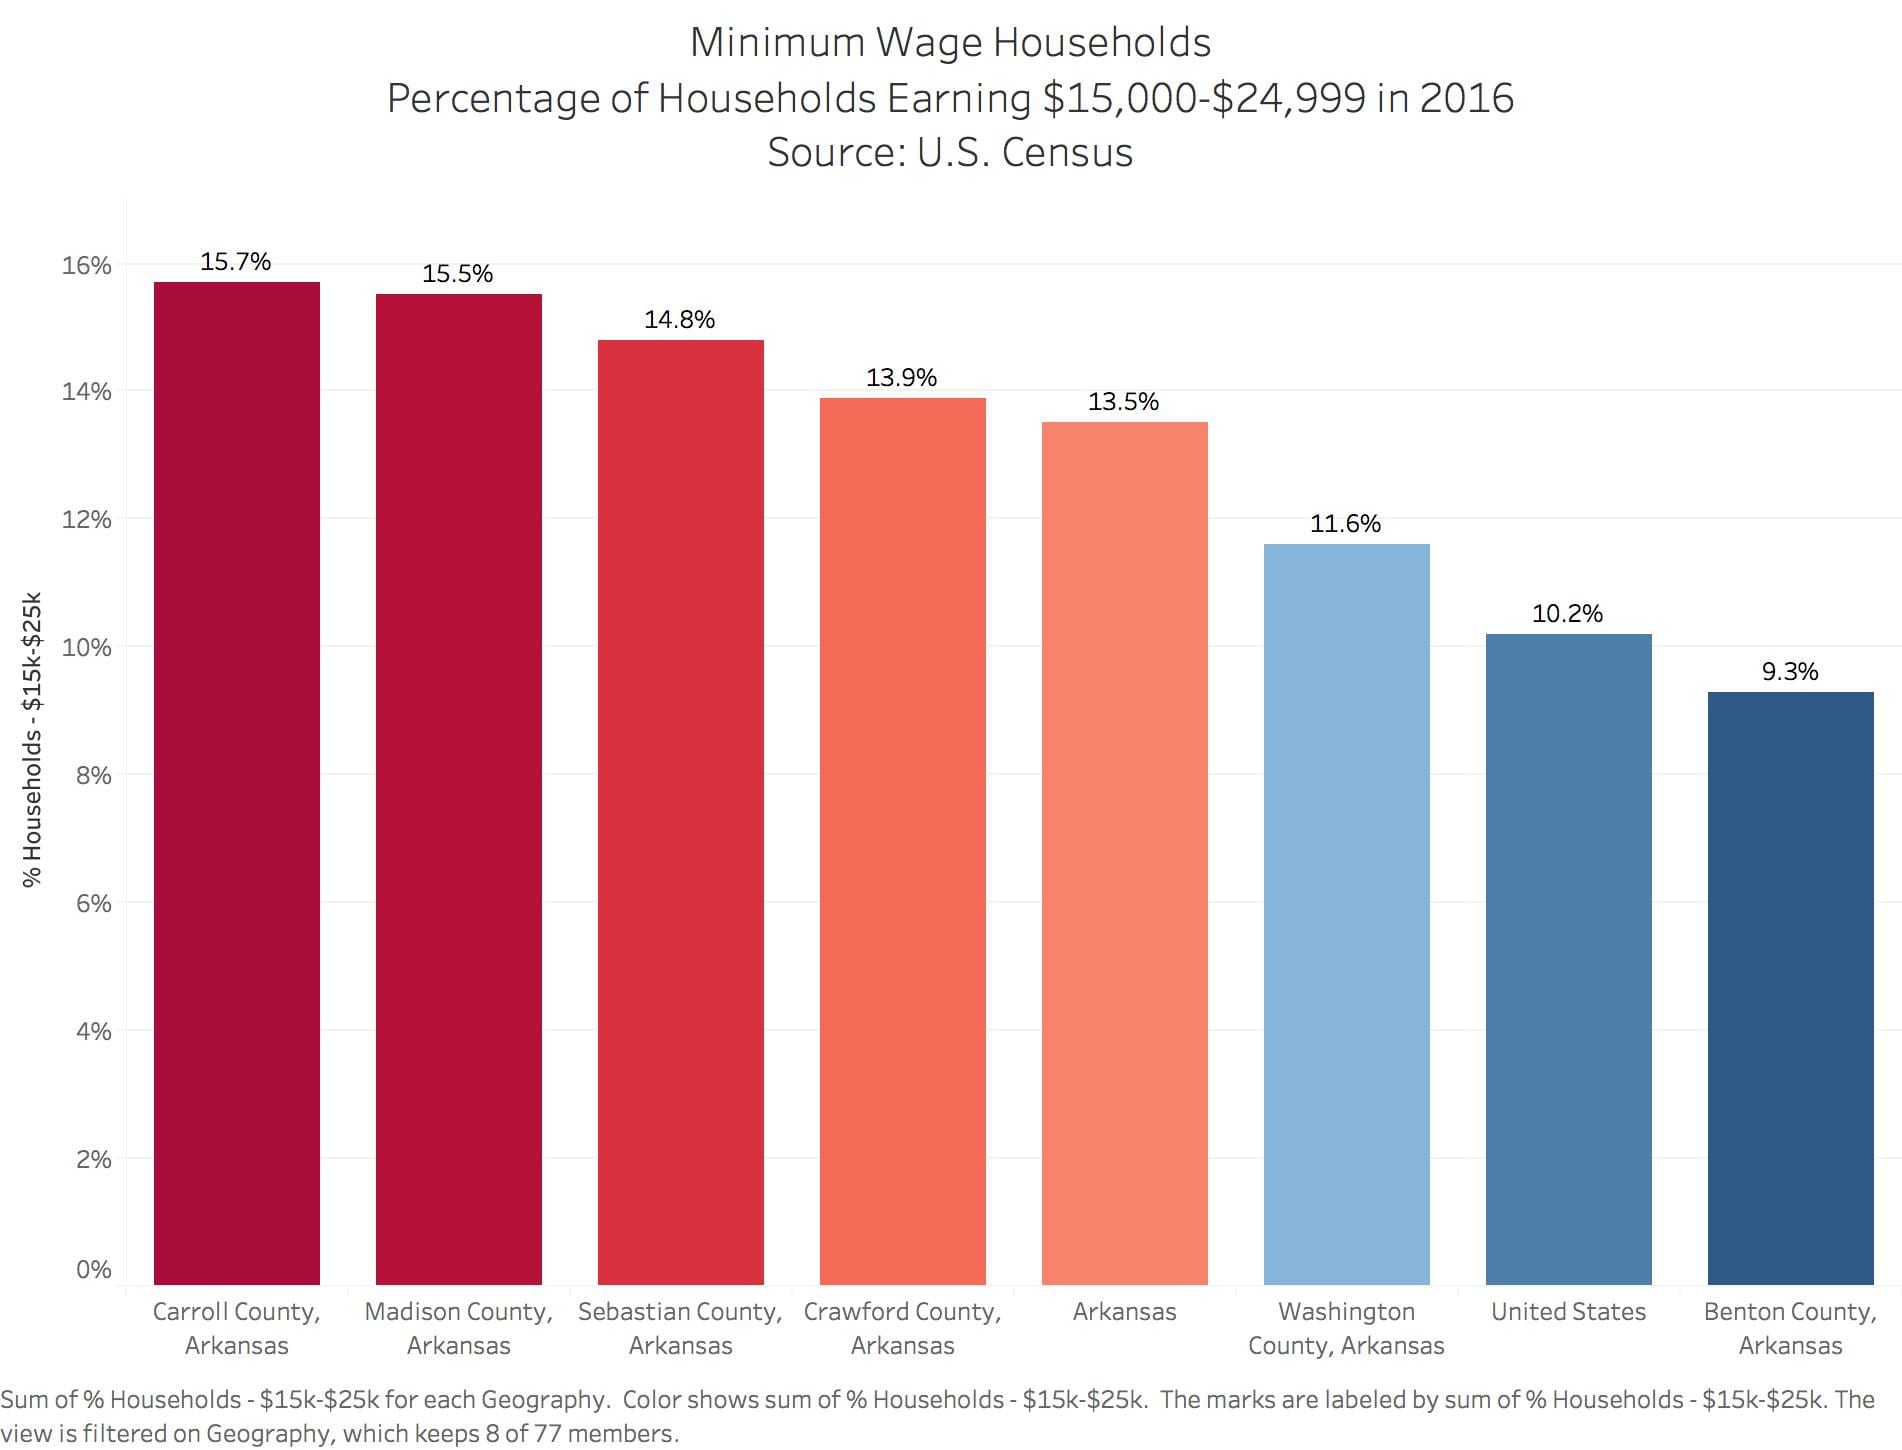
–Label graph: Double Click on “Sheet 1” above the chart. Text box emerges with <Sheet Name> Type in name of chart: Minimum Wage Households Percentage of Households Earning $15,000-$24,999 in 2016 Source: U.S. Census
–Fix X axis labels (squished) . Drag the right chart out to expand the visualization.
Export image
–Worksheet | Export | Image
–Click off color legend option
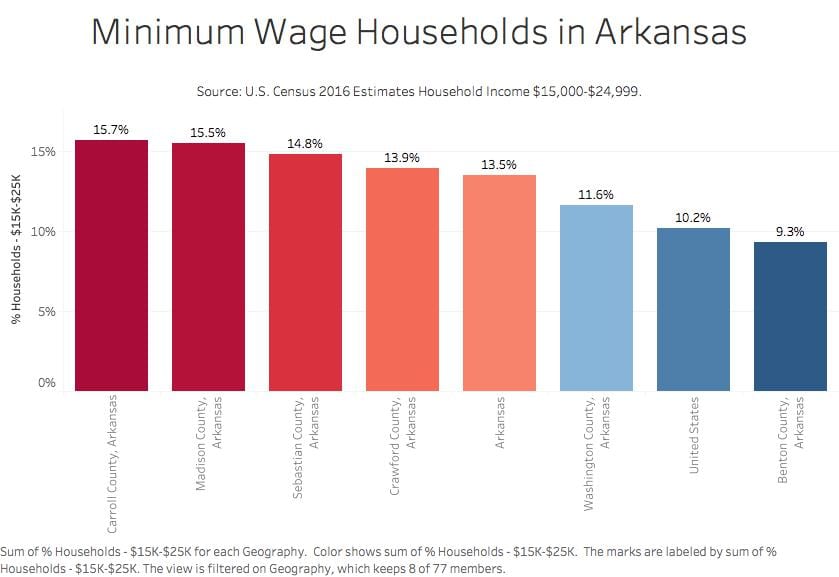
–Title Minimum Wage Arkasas. Save as .jpeg
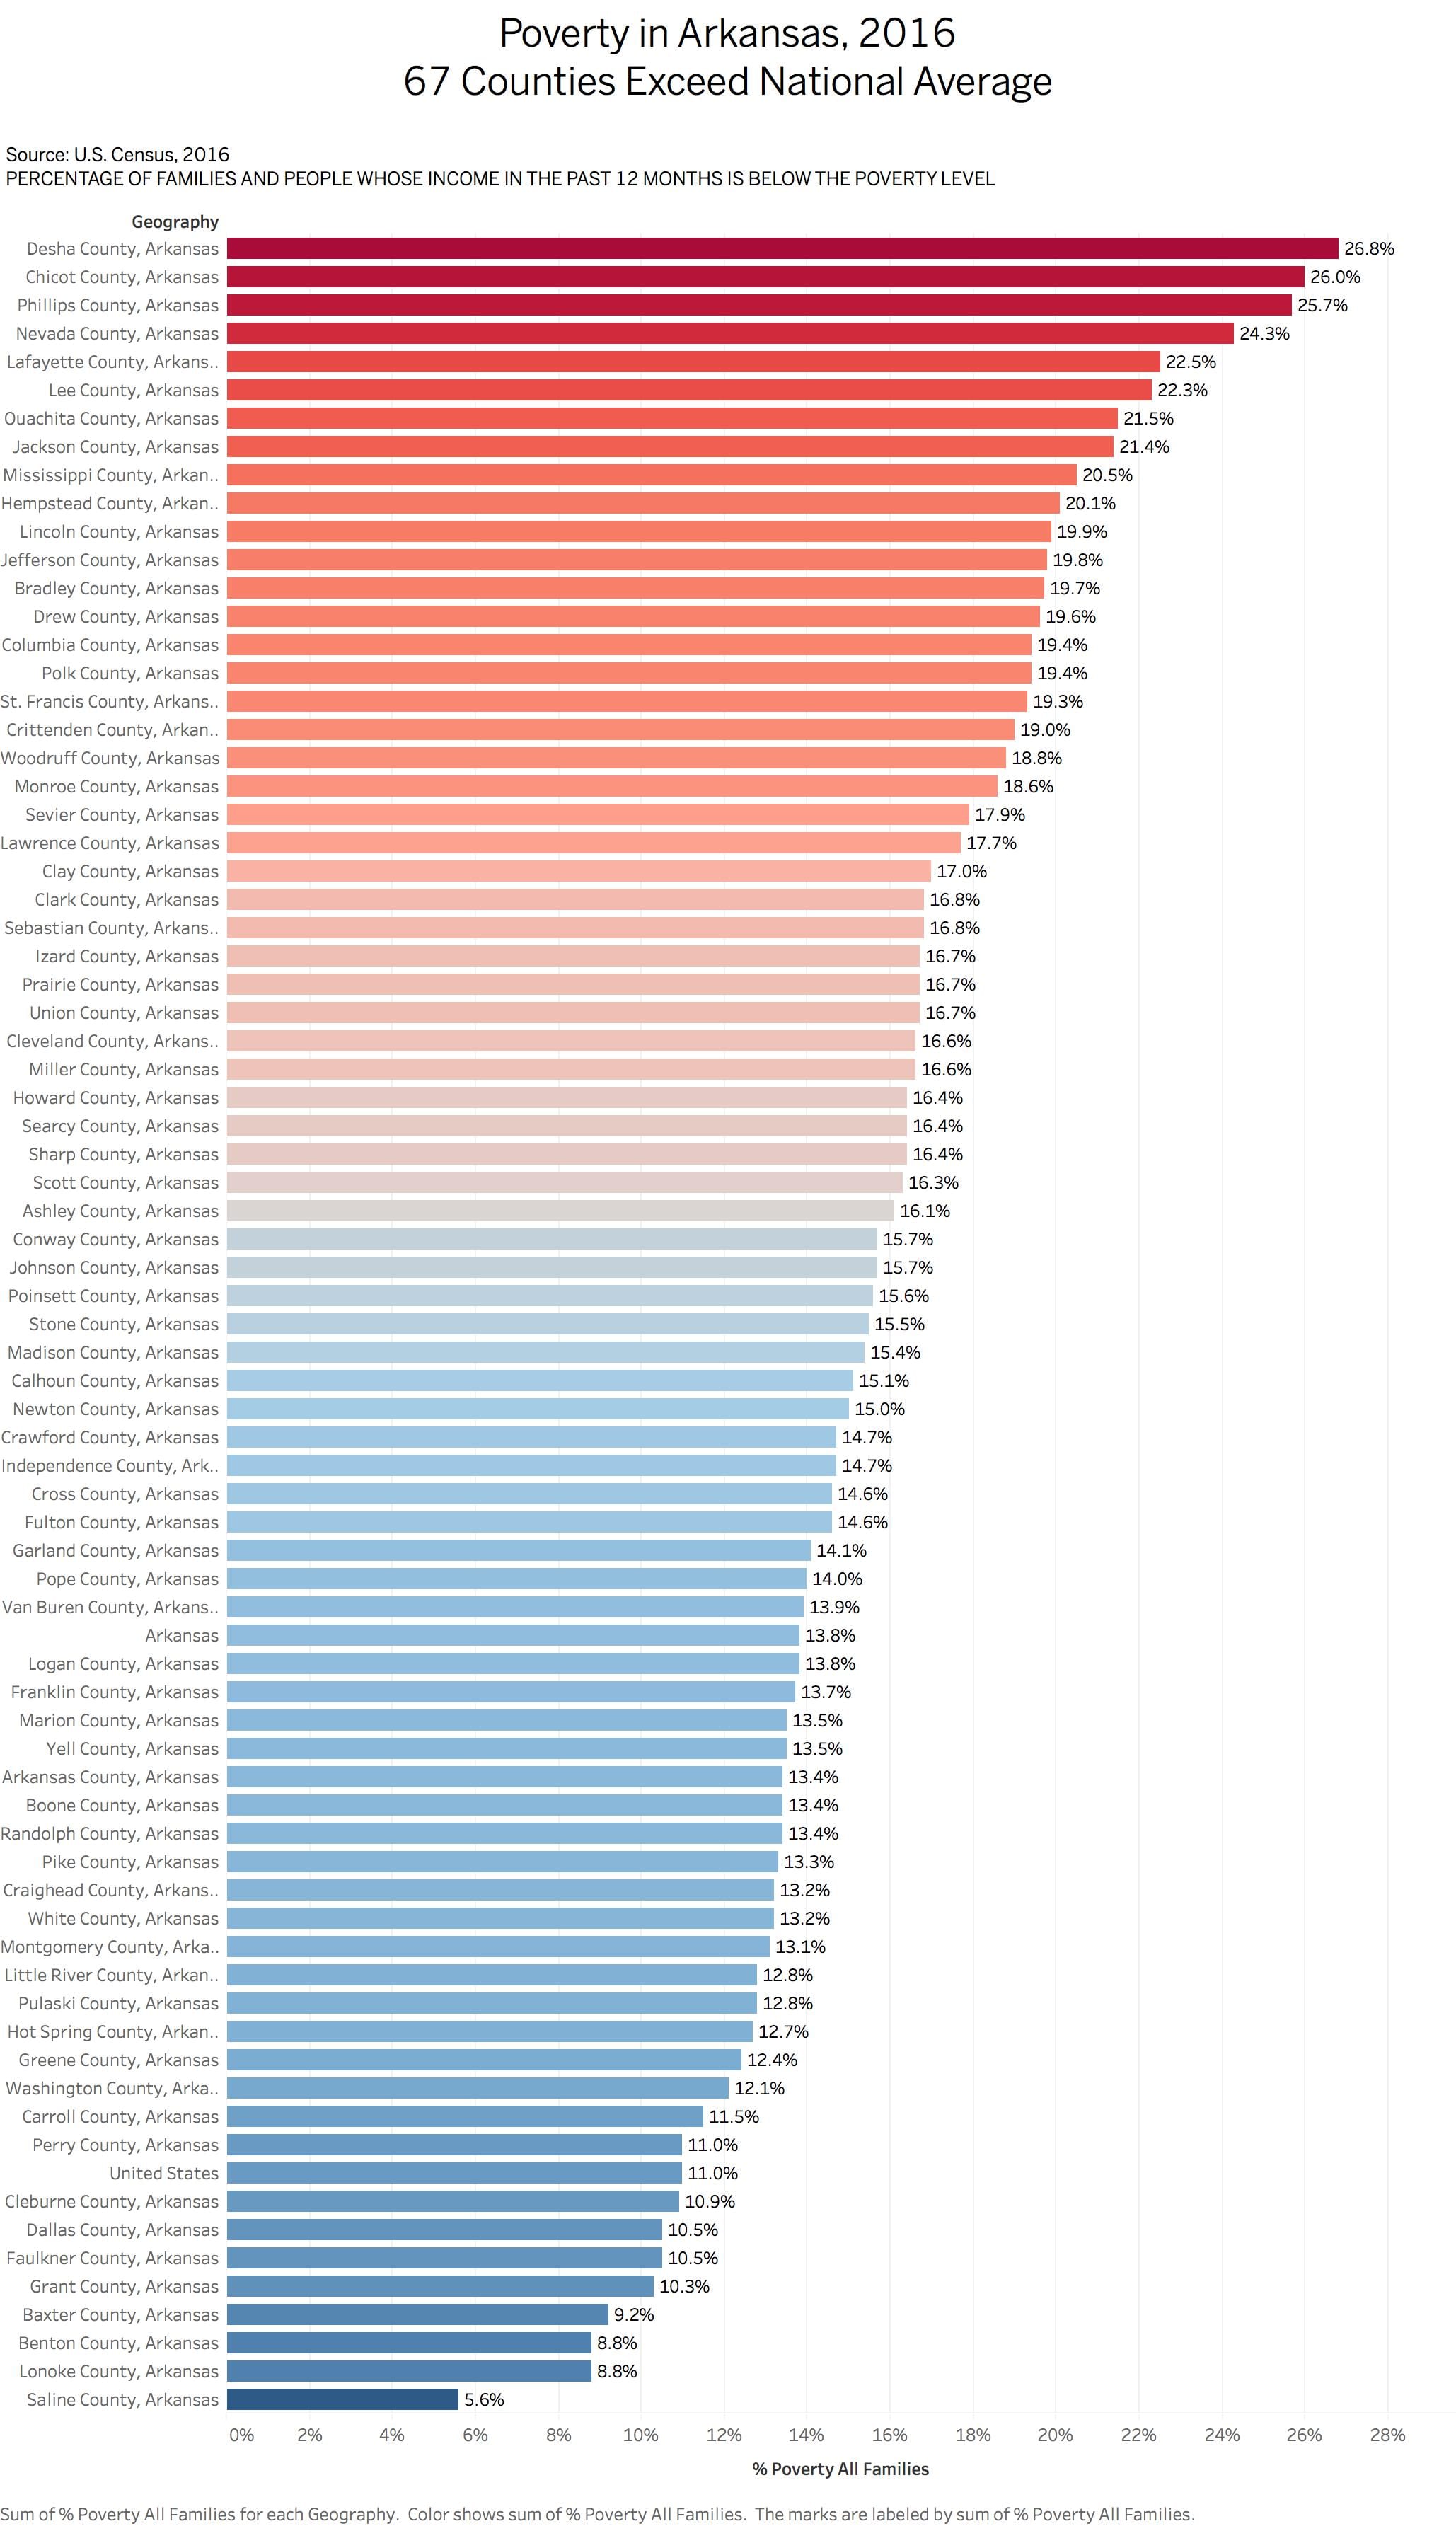
Task #2: Poverty Level Chart
Following the same steps as above, create a simplified spreadsheet with these data sources. You’ll find this data on the tab “ACS_16_5YR_DP03_with…”
#1
HC03_VC161 Percent; PERCENTAGE OF FAMILIES AND PEOPLE WHOSE INCOME IN THE PAST 12 MONTHS IS BELOW THE POVERTY LEVEL – All families
#2
HC03_VC169 Percent; PERCENTAGE OF FAMILIES AND PEOPLE WHOSE INCOME IN THE PAST 12 MONTHS IS BELOW THE POVERTY LEVEL – Families with female householder, no husband present – With related children of the householder under 18 years – With related children of the householder under 5 years only
Produce a statewide chart and a chart filtered for our six counties in NW Arkansas
Bobby Ampezzan

Bobby Ampezzan is a native of Detroit who holds degrees from Dickinson College (Carlisle, PA) and the University of Arkansas (Fayetteville). He’s written for The Guardian newspaper and Oxford American magazine and was a longtime staff writer for the Arkansas Democrat-Gazette. The best dimestore nugget he’s lately discovered comes from James Altucher’s Choose Yourself: “I lose at least 20 percent of my intelligence when I am resentful.” Meanwhile, his faith in public radio and television stems from the unifying philosophy that not everything is serious, but curiosity should follow every thing, and that we all should be serious about curiosity.
Examine Arkansas Public Media’s website. Look at the background of Bobby Ampezzan, the organization’s funding and how they published two School of Journalism projects:
http://arkansaspublicmedia.org/
http://arkansaspublicmedia.org/post/more-arkansas-veterans-face-suicide-risk-homelessness
http://arkansaspublicmedia.org/post/student-journalists-give-va-good-grade-veteran-homelessness-suicide-cause-alarm
http://arkansaspublicmedia.org/post/housing-loans-difficult-most-northwest-arkansas-minorities
http://arkansaspublicmedia.org/post/ua-database-journalism-digs-home-mortgages-race-discoversits-complicated
Task #3: Download Census Demographic data
Household income data for counties and state and national. Gender and demographics of low-wage workers
American FactFinder
https://factfinder.census.gov/faces/nav/jsf/pages/index.xhtml
Advanced Search | Show Me All
Topics | People | Poverty
Geographies | County | Arkansas | All Counties Within Arkansas
Select Table S1701, Poverty Status in the Past 12 Months
Modify Table
—Select top Filter
—Total and Percent Below Poverty Level
—Select second Filter
—Keep Estimate, do not check margin of Error
Download
—Use the Data
Download Again
—View the Data
—Excel spreadsheet
Video on Factfinder
30:00 shows how to use the fact finder
https://www.census.gov/data/training-workshops/recorded-webinars/measuring-america.html
Data Cleaning Census spreadsheets.
–Download the view and the data versions of large spreadsheets. One to guide you. the other to do the work.
–Merge / unmerge cells
–Find-Replace
— =CONCATENATE(B3, B4).
Cleaned and download 2011-2015 estimates with detailed poverty metrics
Ark Counties full income search 5-10-17 ACS_15_5YR_DP03
Narrative Journalism: “The Holdouts”
Examine this article for how the writer uses detail and sets a scene.
Identify specific elements the writer used to set the scene
Examine how she describes cigarettes.
The writer uses the brands to describe cigarettes – what does that do to the story?
Specify the ways that cigarette pricing is discussed
How does the writer convey the notion of stigma?
How does she describe the community of smokers?
How is quitting used as a sub-theme?
What is the purpose of telling the stories of how people came to smoke?
Occupational Employment Data
Arkansas
https://www.bls.gov/oes/current/oes_ar.htm
NW Arkansas
https://www.bls.gov/oes/current/oes_22220.htm
- Identify jobs paying $9.50 an hour or less.
Gender and racial diversity in newsrooms. Note the animation
AP Stylebook Entry on Data Journalism
Data Journalism
Data sources used in stories should be vetted for integrity and validity. When evaluating a data set, consider the following questions:
–What is the original source for the data? How reliable is it? Can we get answers to questions about it?
– Is this the most current version of the data set? How often is the data updated? How many years of data have been collected?
–Why was the data collected? Was it for purposes of advocacy? Might that affect the data’s reliability or completeness? Does the data make intuitive sense? Are there anomalies (outliers, blank values, different types of data in the same field) that would invalidate the analysis?
–What rules and regulations affect the gathering (and interpretation) of the data?
–Is there an alternative source for comparison? Does the data for a parallel industry, organization or region look similar? If not, what could explain the discrepancy?
–Is there a data dictionary or record layout document for the data set? This document would describe the fields, the types of data they contain and details such as the meaning of codes in the data and how missing data is indicated. If the data collectors used a data entry form, is the form available to review? For example, if the data entry was performed by inspectors, is it possible to see the form they used to collect the data and any directions they received about how to enter the data?
Data and the results of analysis must be represented accurately in stories and visualizations. Any limitations of the data must also be conveyed. If one point in the analysis is drawn from a subset of the data or a different data set altogether, explain why this was done.
Use statistics that include a meaningful base for comparison (per capita, per dollar). Data should reflect the appropriate population for the topic: for example, use voting-age population as a base for stories on demographic voting patterns. Avoid percentage and percent change comparisons from a small base. Rankings should include raw numbers to provide a sense of relative importance.
When comparing dollar amounts across time, be sure to adjust for inflation. When using averages (that is, adding together a group of numbers and dividing the sum by the quantity of numbers in the group), be wary of extreme, outlier values that may unfairly skew the result. It may be better to use the median (the middle number among all the numbers being considered) if there is a large difference between the average (mean) and the median.
Correlations should not be treated as a causal relationship. Where possible, control for outside factors that may be affecting both variables in the correlation. Use round numbers where possible, particularly to avoid a false appearance of precision. Be clear about limitations of sample size in reporting on data sets. See the polls and surveys section for more specific guidance on margin of error.
Try not to include too many numbers in a single sentence or paragraph.
Homework
Reading:
Meyer, “New Precision Journalism,” Ch. 1-2
Class Matters (Intro, Ch 1)
Post the following on a blog by 11:59 pm Tuesday, Feb. 6:
On New Precision Journalism, post two questions about material you didn’t understand and want to review in class. Also post about something you liked.
On Class Matters, do you buy the New York Times argument about the importance of class in the modern debate about income inequality? Yes or no.
Interview: Two paragraphs with the name, age, position and some details about your interview subject. Include some good quotes. Write this as you would a news story. Look at the OES database and find the median salary for this occupation.
Data: Finish Task #2, Poverty Charts
–Statewide trends for Arkansas.
–Northwest Arkansas counties
–Statewide trends for female households
–Northwest Arkansas counties female households.
Advanced Research
https://wordpressua.uark.edu/datareporting/advanced-research/
Mary Kerr Winters Blog Post 3
- Two questions for Bobby Ampezzan about how Arkansas Public Media works, what experience you need to publish there, etc.
- On your twitter account, you publicly tweet with a lot of charisma and humor. Is this for any specific reason? A tactic to reach a certain audience? If so, please explain and teach us why.
- What is a characteristic or skill that everyone must have in order to work for Arkansas Public Media?
- At least one question or a significant observation on reporting on the working poor from Ch. 2 of Nickel and Dimed.
- I wonder how the Maids must feel like to constantly be assumed as a thief always being observed under surveillance cameras and tape recorders when they are simply just trying to provide a meal on the table for at least one person? In Chapter 2 of Nickle and Dimed, Barbara Ehrenreich describes in great detail the challenges that housecleaners and “maids” have to face daily, one of them being the constant underlying assumption that these cleaners will try to steal from the homeowners. Homeowners go to great depths to make sure that these women do not attempt theft of their belongings. Ehrenreich tells a story of one women watching her scrub the floors on her hands and knees to not only make sure she does not attempt to steal something, but also to make sure she gets every spot cleaned to the T. I am sure that provides an immense amount of pressure, but it is hard to imagine how that must actually feel. It is similar to (on a much larger scale) when a friend accuses you of stealing a scarf out of her closet, when you promise that it is in fact yours. However, in this case, these homeowners are not your friends at all, and this is not a one-time circumstance; this is a daily affair, and your work becomes your identity as long as you are wearing the uniform. Wow.
- It is also a sad observation that being pregnant, injured, or ill is such a negative thing, and is considered to be your fault. We see this with Barbara’s co-worker or “teammate” Holly. She breaks her ankle on accident, she is malnourished, and she is most likely pregnant, and all of these are considered a burden. They are occurrences that are simply a part of life, but unfortunately to some people, like Holly, they can ruin everything. A pregnancy is usually praised, but to a low-wage worker, this is another mouth to feed, and pregnancy comes with days off. Missing one day of work is one day with no food on the table. It is a sad fact that Holly is the one getting blamed for all of these occurrences rather than life itself.
- List two examples of how the NY Times writer uses detail in The Holdouts. For example, how does she describe cigarettes? How does she describe a sense of community?
- Lizette Alvarez describes the social stigma nowadays in New York City (despite the shockingly high numbers of how many people smoke in the big city) as making “peace with living on the wrong side of acceptable.” Something that was once so normal that if you didn’t participate you stuck out like a sore thumb, is now embarrassing and shameful. “They look at you like you just clubbed a baby seal,” said Mr. Devila. It is interesting how times can change so drastically within a social realm.
- I love how Alvarez utilizes similes and metaphors to describe their small community of smokers. For example, “When it rains, they crowd under a tiny overhang near the loggia and hope the security guard won’t shoo them away like loiterers at a convenience store.” This truly gives the reader a picture of how smokers are portrayed in today’s society; they are being compared to those who linger around and do nothing —mall rats– when in reality they have individual backgrounds and stories.
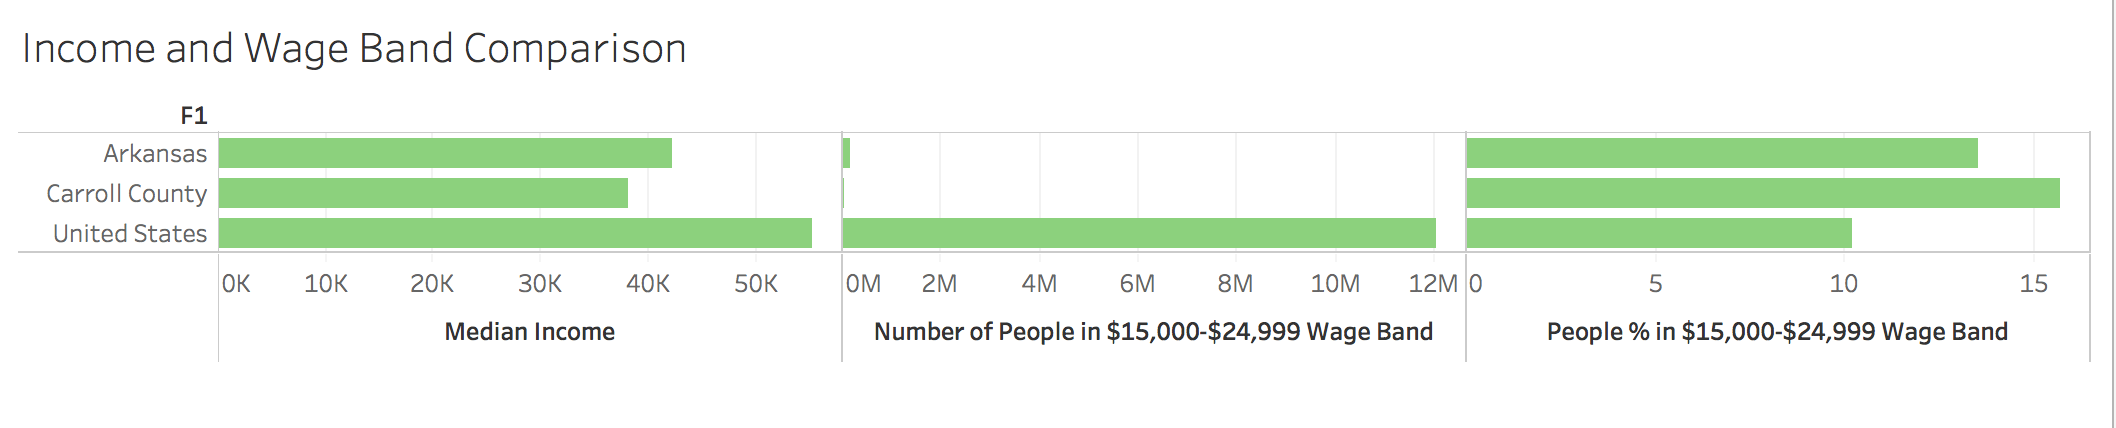
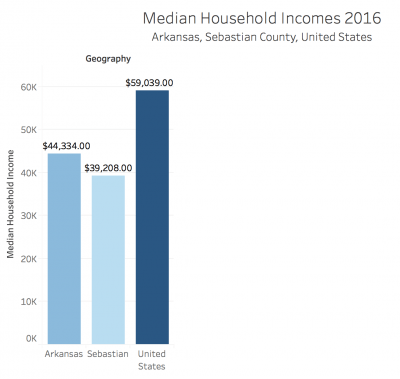
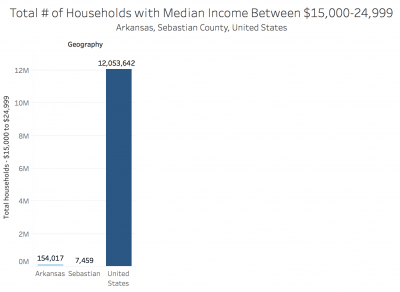
- Chart with census income: find your assigned county’s median income, the number of people in $15,000-$24,999 wage band, and the percentage of people in the $15,000-$24,999 wage band, compare to state and national averages. –BONUS: Visualize this in Tableau, upload graphic
EXCEL SPREADSHEET:
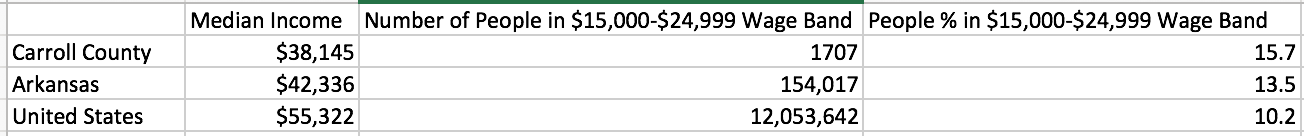
TABLEAU CHART:
- Identify a low-wage worker you intend to interview for the class
- I currently do not have a specific individual in mind yet, however, I do have some more ideas. Possibly a filling station attendant or an auto repair worker? I also like the idea of the women and men (few) who work at a nail salon.
Jan. 30 Blogpost – Andrew Epperson
- (a.) In a week when not much breaking news is happening, what do journalists at Arkansas Public Media do to create content and still produce relevant stories? (b.) What is one thing you know now that you wish you could go back and tell yourself when you first started the job?
- One observation I made that turned into a realization dealt with the maid who broke her ankle in Chapter 2. Ehrenreich panicked and did what any normal person would do, which was to emphatically suggest a trip to the ER with no more work. Instead, the maid felt more disappointed in herself for possibly upsetting her boss and letting him down in some way. Ehrenreich posed the idea that there could have been something else going on with the woman, such as a violent boyfriend at home. The fact that these people have to deal with the emotional and mental states in which they put trivial opinions over their own health was eye opening to me, and Ehrenreich was clearly affected by it, as well.
- Lizette Alvarez’s editorial choices allowed detail to shine through in her piece. One of the descriptions of Oana Marian was nicely done, as she was described as having the personality of a “parent with a gifted child who doesn’t live up to expectations”. This was used to reflect her disappointment in certain things about America after she immigrated here, including the country’s smoking laws. Another great description came in the characterization of Linda Greene’s home. Alvarez creates a scene in which Greene’s cigarette smoke creates a “haze in their one-bedroom apartment a quick walk from Madison Square Park”. The simple addition at the end allowed the reader to understand the proximity of Greene’s home compared to a place most Americans have heard of and know.
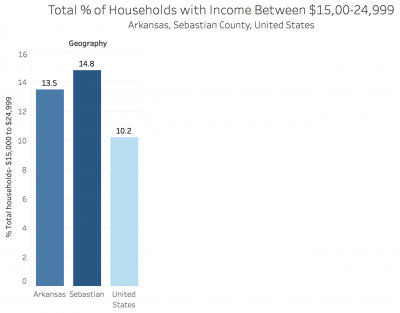
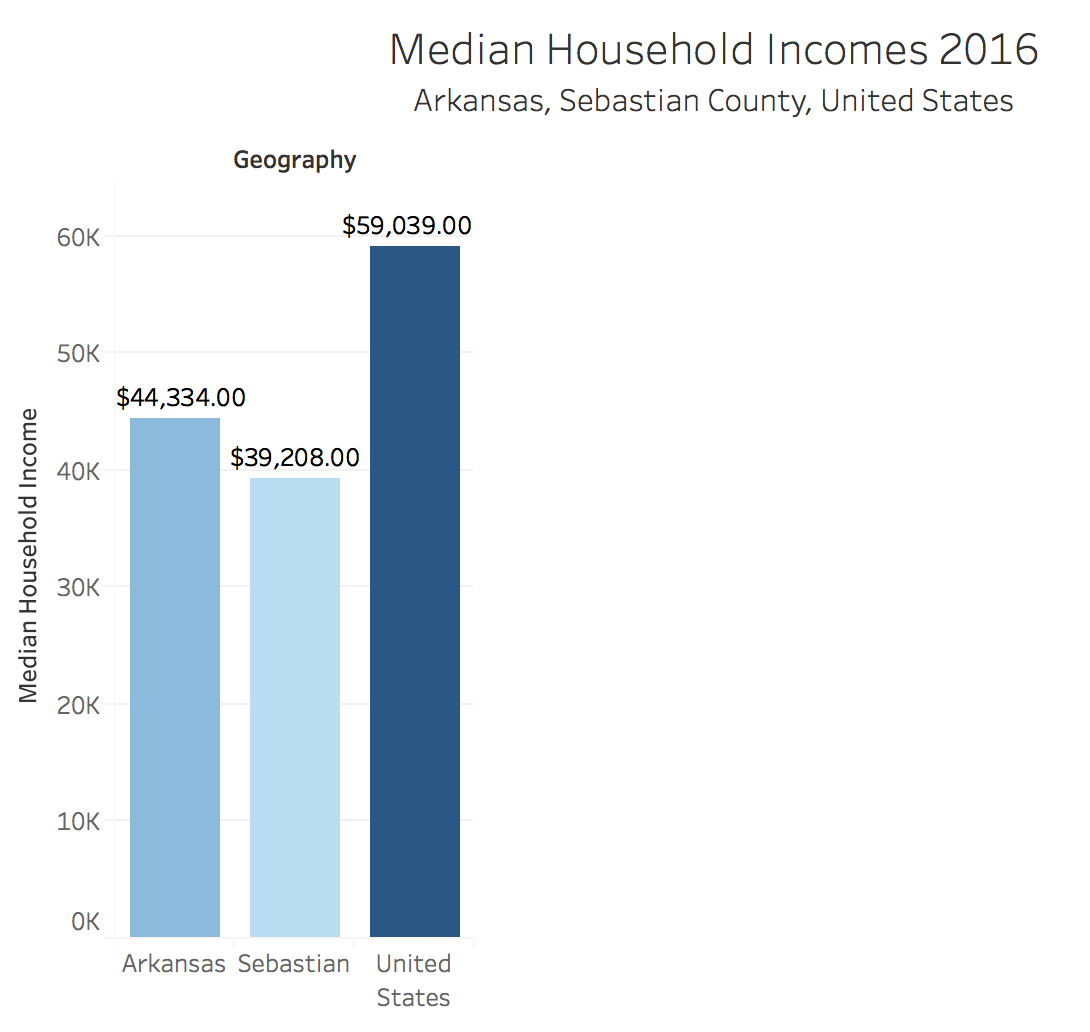
- Madison County’s median household income is $33,726. There are 976 people living in the bracket that makes $15,000 to $24,999, meaning 15.5 percent of the population. The state average is 13.5 percent, meaning a slightly higher percentage of people living in Madison County are in that bracket. The national percentage is 10.2 percent, so both averages are slightly higher in Arkansas than across the country.
- I’m going to interview a woman named Jenny who was formerly homeless but now works at 7Hills. She now has a home, but she once lived in the woods like many of the homeless individuals in Northwest Arkansas.
Butler Blog Post 2
- Questions for Bobby Ampezzan
- Though you work in television and radio, how does print journalism remain relevant in a world absorbed by electronic media?
- When can curiosity take you too far?
- One significant observation I made was the presence of low-skilled workers among low-income workers, and the expectation of failure in these jobs. The training Ehrenreich goes through at the maid job implies the low expectation of success, and the high expectation of failure. She even begins to ask the question of “how poor are my coworkers” (pg 77). This section of the chapter helps me develop a couple of assumptions regarding the working poor. For one, there should be no “income sector”, numerical, specific set of numbers that describes the working poor. Men and women who live paycheck to paycheck because of their low wage jobs are the working poor, simply because they are working and they are poor. There are variety of types of people in differing levels of poor that work these low income jobs.
- The author uses details greatly in this story. Her way of describing cigarrettes not only makes you almost smell them and want one, but see the price people pay to smoke them. She mentions the health and legal complications smokers go through via intense detail and strong language. She also uses detail in describing a sense of community; these smokers were not at all together (I don’t think) at any point during the interviews, but it feels as if they are sitting around a table sharing stories. The issues smokers face imply a sense of community because they are all suffering together.
- Census Data
- United States: The national amount of workers in the wage band given is 12,053,642, 10.2%
- Arkansas: 154,017, 13.5%.
- Washington County: 9,712, 11.6%
- I intend to interview a few of the servers at Iron Skillet in Fayetteville.
Aubry Tucker Blog Post 2
Two questions for Bobby Ampezzan about how Arkansas Public Media works, what experience you need to publish there, etc
- What in your background/experience prepared you for your position as managing editor?
- How do you vet information? or How do you recommend your writers vet? or What are key red flags to know you shouldn’t trust information?
At least one question or a significant observation on reporting on the working poor from Ch. 2 of Nickel and Dimed.
In chapter 2: “Scrubbing Maine” of Nickel and Dimed something I noticed about the reporting is that much of what someone would consider typical reporting is often found in the footnotes. Ehrenreich chooses to write heavily in a narrative style then add context with facts in the footnotes. I think this is an interesting strategy because it keeps the reader engaged and as if they’re hearing it from someone they may know rather than a never to be known/knows more than I do/I can’t relate reporter. It gives the story emotion and allows the reader to feel compassion or empathy for her situation, and in turn the challenging situation so many Americans face in making ends meet.
List two examples of how the NY Times writer uses detail in The Holdouts. For example, how does she describe cigarettes? How does she describe a sense of community?
The NY Times writer uses detail in a metaphorical sense. The first comparison she makes, “most conversations lasting only as long as the ember at the tip of their cigarettes.” emphasizes that the gratification the smokers are getting is short lived, and that they–the cigarettes–like the conversations are lacking in depth.
ehhhhh I do have a problem with the “she pocketed the cash and lighted up anyway” I’m thinking that should be lit up anyway… come on NY Times….but I digress.
anyway… Another use of detail in this story I think is worth mentioning is “he and the others point out that their smoke rings are nothing compared with the fumes buses belch out onto city streets. They wonder aloud why the city does not address that hazard. Not that they don’t know: People need buses. People don’t need smokers” this is an interesting detail to me because although it does seem to have a degree of speculation–do they really know this is the reason? The subjects may feel like they ‘need’ the cigarettes so maybe this is the same concept?–it is an interesting point to compare the cigarettes to emissions by public transportation. If the motive to decreasing smokers is truly a health concern by the public then why don’t they take these emissions as seriously? Because they aren’t the ones suffering the consequences of addition, but if buses were suddenly stigma-d as public health risk number one and slowly outlawed and become fewer and farther between the social construct of those who continue to use the bus as their way of commuting would be associated with the negative stigma as well. I’m not saying smoking is good and I’m not saying public transportation is bad. Just making connections here.
Chart with census income: find your assigned county’s median income, the number of people in $15,000-$24,999 wage band, and the percentage of people in the $15,000-$24,999 wage band, compare to state and national averages.
My assigned county is Benton. Median income:$59,016 People making $15,000-24,999: 8,223 Percent of people in same wage bracket: 9.3% Comparison to state and national averages: Benton County’s median income is higher than Arkansas and national medians. The percent of those in this wage bracket is the lowest of the three.
Identify a low-wage worker you intend to interview for the class
at this time 10:03 on Tuesday night I have not found a low-wage worker to interview. However I do have more ideas outside of restaurants…
Maybe the woman who drives my apartment shuttle to and from campus every 45 minutes, or the custodian to the bus station I saw switching trash bags while I waited for the bus one night (working for the university I’m not sure this custodian is a low-wage worker) these are a couple options I would like to explore further. I am tentative to reach out to people considering this is a sensitive topic. Hello, I’m a reporter. Do you struggle to make ends-meet even with a full time job? I feel the need to tread lightly.
Ann Claire Johnson Blog Post #2
Ann Claire Johnson
1.30.18
HW: Blog Post
Advanced Reporting
- Two questions for Bobby Ampezzan about how Arkansas Public Media works, what experience you need to publish there, etc.
- If I wanted to write for Arkansas Public Media, are there any publications I should avoid working at prior to this one?
- When applying to write for Arkansas Public Media, does it help or hinder me to be more creative with my writing?
- At least one question or a significant observation on reporting on the working poor from Ch. 2 of Nickel and Dimed.
- One scene in the book that stood out to me was when Earl is talking about the kitchen. I think that the way she is observing this situation and that she notices how shanty this house is tells us how different it is to her previous life style. “We go into the basement of the ramshackle combination motel and boardinghouse, where Earl indicates a closed door—the kitchen, he says—but we can’t go in now, because a guy is sleeping there. He chuckles, as if sleeping in kitchens is just another one of the eccentricities you have to put up with in the landlord business” (Nickel and Dimed, 55).
- List two examples of how the NY Times writer uses detail in The Holdouts. For example, how does she describe cigarettes? How does she describe a sense of community?
- The is how she describes high expectations followed by disappointment, “But, like a parent with a gifted child who doesn’t live up to expectations, she has been occasionally disappointed. She expected a meritocracy, where hard work and intelligence rule the day, and found that whom you know and how you present yourself can best the best. The smoking rules, too, bring back a few memories of her childhood.”
- This is how she describes the urgency to smoke cigarette despite it not reaching the peak of it’s popularity yet, “There was a time, not so long ago, that no one lingered, cigarette in hand, between the MetLife buildings on East 24th Street. They smoked at their desks, or, later, in a smoking lounge. Then in 1995, City Hall started rolling out its restrictions and the herding began: big room to small room, inside to outside, public to private, acceptable to anathema.”
- Chart with census income: find your assigned county’s median income, the number of people in $15,000-$24,999 wage band, and the percentage of people in the $15,000-$24,999 wage band, compare to state and national averages. –BONUS: Visualize this in Tableau, upload graphic
- My county was Crawford county. They have 3277 people in the $15,000-$24,999 wage band, and the percentage of people in that wage band is 13.9%. Compared to the state average of the number of people in that wage band (154,017), Crawford County counted for 1/47 of it. Compared to the United States number of people in that wage band (12,054,642), Crawford County Counted for 1/3679 of it.
- Identify a low-wage worker you intend to interview for the class
- I will be interviewing a stripper from the Gentleman’s Club. (Strip Club)
Blog Post 2 Katie Serrano
- On the APM “about us” webpage, your mission statement says that you “believe our Arkansas members want and deserve better journalism.” What is it about APM that you believe accomplishes that and sets it apart from existing media, and how can we as students work toward that quality? How do you “compete” with long-running local papers such as the Democrat-Gazette, which has such a larger staff/managing team?
- The first line of the chapter talks about race, which I think if approached correctly can offer up important information from the individual I am interviewing. NWA is a predominately white community, and I don’t want to assume that the majority of individuals I will talk to will be a certain ethnicity, but depending on their race, I plan to ask them about the other demographical trends they see in their workplace, or if it has affected where they’ve been hired and the opportunities they’ve been given.
- One line that stuck out to me specifically was “These days, he zips down for a Marlboro Light twice in the morning, at lunch, and twice in the afternoon. Sure, he feels winded when he climbs stairs. But it’s not as if he was planning on running a marathon.” It gives the reader a sense of how he feels after smoking and the extent to the toll it is taking on his body, even if the reader themselves have never smoked. The other paragraph beginning with “So they stand in ever-shrinking clusters all over New York, their turf continually circumscribed, or so it seems..” and ending in “…they crowd under a tiny overhang near the loggia and hope the security guard won’t shoo them away like loiterers at a convenience store,” sets the scene for the reader. They can see the groups of smokers even though they’re not actually there, and the scene is relatable and can be compared to local areas in their own towns.

5. Magaly Licolli, Poulty Factory Worker, Tyson
Advanced Research
Interactive Data Graphic
This Tableau workbook examines food stamp usage statewide.
Tasks:
- Construct a simple but effective filter / toolbar so readers can play with this map and learn more about their communities. See notes below on filtering.
Notes on Filtering
Add a Filter to Control All Cities on Worksheet
Filters on Dashboards
When we click through a filter, we see that by default, it only applies to the view it came
out with. If we want to make this filter apply to more of the dashboard.
–We simply click on the filter (down triangle icon), open the menu, and under Apply to Worksheets, select “all related data sources”
Now when we make a selection, it applies to the whole dashboard,
Similarly, we can make a view act as a filter for the dashboard. Click on the view to bring
up the header bar, and click the filter icon. Now if we select a header such as Second
Class, all the relevant views are filtered.

Butler – Blog Post: Ehrenreich Chapter 1
- Ehrenreich provides an insightful, yet troubling view of the working poor and the common challenges they face. The author herself faced a life of employment much different than the ones that went before her, sitting at a desk rather then working in a mine. However, she gives up this comfort and security to put herself in the shoes of those who have no choice but to live that life. She first discusses the struggles of finding a place to live. What most low-income workers deal with is finding places that are not just affordable, but affordable so you can have money left over for the rest of your expenses. Even for Ehrenreich, who has money to spend that is not from her earnings, struggles to comprehend making ends meet for housing and expenses. Ehrenreich begins applying for jobs – wanting to scream at the variety of managers “this is a project, not my life”. However, she begins to understand the tribulations that low-income workers go through that make it a) hard to get a job, and b) hard to keep a job. She mentions drug testing, applications, the interview process to never get a call back, and the struggle of not having clothes to wear to a job interview. Once in the position as a server, she experiences foul treatment from the men at her restaurant, both workers and customers. (Personal note, I am a server, and this is true and just as hurtful to me, working for extra money and not my primary income). When it comes to transportation, Ehrenreich maintains her vehicle, but sees the hardship her coworkers face when they don’t have one, or when their car is also their home. While many of the hardships that “regular” low-income workers face don’t impact Ehrenreich in the same way, she experiences them on a level that is detrimental for her success on this project.
- First, I would start with places like grocery stores and mom-and-pop restaurants. The Iron Skillet down School Ave is primarily staffed by middle-aged women working the same job I do. This is a place much like Jerry’s where Ehrenreich works, giving some valuable insight into low-income workers like the author found. Such questions to ask would be very personal yet very important, and could even come off rude in some scenarios. However, they could be questions such as:
- How do you manage the instability of tips and keep an income that way?
- How do you emotionally handle the comments of the men that come in almost daily?
- Do you have a second job?
- Do you struggle to make ends meet?
Across town, I’m a server at Grubs, which brings in an entire different clientele from the Iron Skillet. I would ask some of my coworkers, or at the other Grubs locations, the same questions. The majority of people who work at Grubs are in college or fresh-out, mostly living off of their parents still but they choose to work this job for some extra cash. I am curious to see how similar or different the answers would be for two different demographics of servers.
Class 2: Jan 25, 2018
Agenda
Nickel and Dimed: Ehrenreich, Barbara. Nickel and Dimed: On (Not) Getting By in America. Macmillan, 2001. Introduction, Ch. 1
–Discussion of how to write about working poor. Blog: Nickel & Dimed, write about reporting techniques and ideas for reporting on low wage economy.
–Define the term “Working Poor.”
— Blog: Questions for interview subjects. Where to go and find them.
Numbers in the Newsroom
Excel:
–Minimum wage
–Students assigned geographical location for Census data.
–Data Cleaning Census spreadsheets.
–Tableau.
Homework
Questions
How they got to where they are, and what they see for themselves going forward.
“Was there anything you could have done to prevent living in this situation, and is there anything you believe you can do to get out of it?”
“Do you believe officials can and should help you and why?”
Is it hard to refrain from treating yourself or do you just block out the option of ever living out of your means?
If you had all the money in the world, what would be the first thing you spent it on?
How do you manage the instability of tips and keep an income that way?
How do you emotionally handle the comments of the men that come in almost daily?
Do you have a second job?
Do you struggle to make ends meet?
One question to ask a poverty-stricken worker is, “What is your living situation like, and do you feel comfortable in the place you’re staying now?”
“Was there anything you could have done to prevent living in this situation, and is there anything you believe you can do to get out of it?”
“Do you believe officials can and should help you and why?”
I would ask about kids, what ends they are trying to meet, the types of neighborhoods they live in our their living situations.
How they got to where they are, and what they see for themselves going forward.
One question I would ask is, when do they make the decision to sacrifice one necessity or want for another?
How much does the order of your necessities change by priority when you have children or a significant other?
What are the little things that you save on or sacrifice that make a difference for your every day budget?
Is it hard to refrain from treating yourself or do you just block out the option of ever living out of your means?
If you had all the money in the world, what would be the first thing you spent it on?
Numbers in the Newsroom

Sarah Cohen, Math Diva
Sarah Cohen’s “Numbers in the Newsroom” is a classic in journalism numeracy. She is a Pulitzer-winning journalist at The Washington Post, a former Duke University professor and now a data journalist at The New York Times.
* Limit yourself to 8- 12 digits, including dates such as 2012, in a single paragraph.
–This allows us to stress the most important numbers
A refresher on AP Stylebook on numbers
–Simplify your story using rates, ratios or percentages. “One in four” = ratio or rate. “Forty percent” = ratio or rate. 235 deaths per 100,000 is another. See pg. 11
*Memorize some common numbers on your beat: Population of Fayetteville. Population of Arkansas. Population of the U.S. Per capita income Arkansas and U.S.
*Round off! Unless you’re dealing with really small numbers, decimal points may not be meaningful. “I’m a big fan of rounding,” Cohen said.
* Portion of whole – For example, at the time of the Million Man March in 1995, a turnout of 1 million black men would have represented 1/12th of all the black men in the country at the time.
Class exercise: Cohen: Think in ratios – construct a ratio on the poverty beat. Memorize common numbers on the beat:
Use the Census Poverty Data: US Ark Counties Poverty ACS_16_5YR_DP03_with_ann-1w6iwss
–In the spirit of “memorizing numbers on your beat,” find three statistics about poverty in this dataset
–Construct a rate or ratio about the number of households earning $15,000 to $24,999 for the U.S., Arkansas, and the counties with the highest and lowest percentages in this category. Remember – “percents are Fractions. Fractions are percents”
Relative Risk
“Black applicants are denied mortgages at twice the rate of whites with similar incomes.”
If 20 smokers per thousand contract cancer, and yet non-smokers have a cancer rate of only 10 per thousand, the relative risk of smoking is 2.
“More than” or “less than” = compute difference between the smokers, an extra step
Example: Relative Risk
Minimum Wage
https://www.marketwatch.com/story/new-year-brings-minimum-wage-increases-to-18-states-2018-01-01
What is the Minimum Wage Around the Country?
https://www.dol.gov/whd/minwage/america.htm#stateDetails
Exercise: Build a Spreadsheet: Hourly minimum wage for Arkansas & Beyond
Rows:
Hourly minimum wage for Arkansas
Federal hourly minimum wage
$11 / hour
$15 / hour
Columns:
Hourly Wage
Weekly Wage
Monthly Wage
Yearly Wage

Bonus:
Create separate columns adjusted for taxes
Part 2: Monthly Budget
Construct a Monthly Budget For People Living on A Minimum Wage, $11 / hour wage, USA minimum wage.
Besides rent and food, what other expenses would you include?
Homework
Prepare for Bobby Ampezzan, guest speaker for next week.
Reading:
Nickel and Dimed, Ch 2.
Read : “The Holdouts”
Examine this article for how the writer uses detail and sets a scene.
Examine Arkansas Public Media’s website. Look at the background of Bobby Ampezzan, the organization’s funding and how they published two School of Journalism projects:
http://arkansaspublicmedia.org/
http://arkansaspublicmedia.org/post/more-arkansas-veterans-face-suicide-risk-homelessness
http://arkansaspublicmedia.org/post/student-journalists-give-va-good-grade-veteran-homelessness-suicide-cause-alarm
http://arkansaspublicmedia.org/post/housing-loans-difficult-most-northwest-arkansas-minorities
http://arkansaspublicmedia.org/post/ua-database-journalism-digs-home-mortgages-race-discoversits-complicated
Blog: Due 11:59 pm Tuesday Jan 30
In a single blog post, write the following:
- Two questions for Bobby Ampezzan about how Arkansas Public Media works, what experience you need to publish there, etc.
- At least one question or a significant observation on reporting on the working poor from Ch. 2 of Nickel and Dimed.
- List two examples of how the NY Times writer uses detail in The Holdouts. For example, how does she describe cigarettes? How does she describe a sense of community?
- Chart with census income: find your assigned county’s median income, the number of people in $15,000-$24,999 wage band, and the percentage of people in the $15,000-$24,999 wage band, compare to state and national averages. –BONUS: Visualize this in Tableau, upload graphic
- Identify a low-wage worker you intend to interview for the class
Assigned counties:
Andrew – Madison
Katie – Sebastian
Elizabeth – Washington
Aubrey – Benton
Ann – Crawford
Mary Kerr – Carroll
Census Data Download And Cleaning
Census, American Fact Finder
https://factfinder.census.gov/faces/nav/jsf/pages/index.xhtml
Selected Economic Characteristics DP03 2012-2016 American Community Survey 5-Year Estimates
30:00 shows how to use the fact finder
https://www.census.gov/data/training-workshops/recorded-webinars/measuring-america.html
Data Cleaning Census spreadsheets.
–Download the view and the data versions of large spreadsheets. One to guide you. the other to do the work.
–Merge / unmerge cells
–Find-Replace
— =CONCATENATE(B3, B4).
Cleaned and download 2011-2015 estimates with detailed poverty metrics
Ark Counties full income search 5-10-17 ACS_15_5YR_DP03
Students assigned geographical location for Census data.
Questions:
–Number and Percentage of Minimum Wage Households?
–Compare to National, State Averages
–Produce basic Tableau chart
Washington: Ann Johnson
Benton: Elisabeth Butler
Madison: Andrew Epperson
Sebastian: Katie Serrano
Crawford: Aubry Tucker
Carroll: Mary Kerr Winters
Optional Material
AP Stylebook Entry on Data Journalism
Data Journalism
Data sources used in stories should be vetted for integrity and validity. When evaluating a data set, consider the following questions:
–What is the original source for the data? How reliable is it? Can we get answers to questions about it?
– Is this the most current version of the data set? How often is the data updated? How many years of data have been collected?
–Why was the data collected? Was it for purposes of advocacy? Might that affect the data’s reliability or completeness? Does the data make intuitive sense? Are there anomalies (outliers, blank values, different types of data in the same field) that would invalidate the analysis?
–What rules and regulations affect the gathering (and interpretation) of the data?
–Is there an alternative source for comparison? Does the data for a parallel industry, organization or region look similar? If not, what could explain the discrepancy?
–Is there a data dictionary or record layout document for the data set? This document would describe the fields, the types of data they contain and details such as the meaning of codes in the data and how missing data is indicated. If the data collectors used a data entry form, is the form available to review? For example, if the data entry was performed by inspectors, is it possible to see the form they used to collect the data and any directions they received about how to enter the data?
Data and the results of analysis must be represented accurately in stories and visualizations. Any limitations of the data must also be conveyed. If one point in the analysis is drawn from a subset of the data or a different data set altogether, explain why this was done.
Use statistics that include a meaningful base for comparison (per capita, per dollar). Data should reflect the appropriate population for the topic: for example, use voting-age population as a base for stories on demographic voting patterns. Avoid percentage and percent change comparisons from a small base. Rankings should include raw numbers to provide a sense of relative importance.
When comparing dollar amounts across time, be sure to adjust for inflation. When using averages (that is, adding together a group of numbers and dividing the sum by the quantity of numbers in the group), be wary of extreme, outlier values that may unfairly skew the result. It may be better to use the median (the middle number among all the numbers being considered) if there is a large difference between the average (mean) and the median.
Correlations should not be treated as a causal relationship. Where possible, control for outside factors that may be affecting both variables in the correlation. Use round numbers where possible, particularly to avoid a false appearance of precision. Be clear about limitations of sample size in reporting on data sets. See the polls and surveys section for more specific guidance on margin of error.
Try not to include too many numbers in a single sentence or paragraph.
Gender and racial diversity in newsrooms. Note the animation
https://googletrends.github.io/asne/?view=0
Narrative Journalism: “The Holdouts”
Examine this article for how the writer uses detail and sets a scene.
Identify specific elements the writer used to set the scene
Examine how she describes cigarettes.
The writer uses the brands to describe cigarettes – what does that do to the story?
Specify the ways that cigarette pricing is discussed
How does the writer convey the notion of stigma?
How does she describe the community of smokers?
How is quitting used as a sub-theme?
What is the purpose of telling the stories of how people came to smoke?