Agenda for Monday, Oct. 8
–Context!
–Common Errors
Context #1
Add the Quick Facts for city population, demographics.
Little Rock: African American comprise 42 percent of Little Rock’s population. https://www.census.gov/quickfacts/fact/table/littlerockcityarkansas,US/PST045217
Add typical salary from Occupational Employment Statistics database for Arkansas
https://www.bls.gov/oes/current/oes_ar.htm
Common Errors – Math
Percent vs Percentage Point
At Lyon College, 67 percent of non-first-generation students paid back their loans within five years, while only 53 percent of first-generation students did the same, which results in a 14 percent POINT difference. The median debt for both types of students was the same though, at $12,000.
You mean “percentage point.” 14 percent of 67 is 9.4.
Steve Doig – MathCrib-Doig
Common Errors – AP Style on Numbers
AP Style on Numerals:
Numerals – AP Stylebook-2avrxtn
Common Error – Divi Library
Divi Builder. Do Not Save to Library.
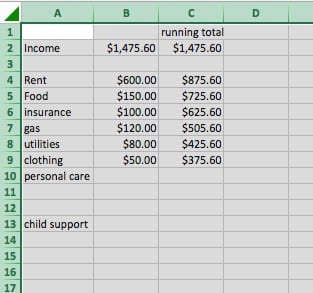
Context #2: Build Charts for Context
First row: The overall median debt for Arkansas students; for men, for women.
Second row: The overall median debt for first generation students. And non-first generation
Third row: The overall statewide repayment rate, and the rate for men, for women
Fourth row: The overall median debt for white, black, asian, hispanic
Post on WordPress with the category Context
Research – Data Question
The Financial Aid department does not report loan repayment info to the Department of Education. “Once the students leave us we don’t track their information anymore,” he said.
Question: Look at data dictionary for source of this information. All 1,826 columns explained here.
https://collegescorecard.ed.gov/assets/FullDataDocumentation.pdf
https://collegescorecard.ed.gov/assets/CollegeScorecardDataDictionary.xlsx
Homework
#1: Read this report and compare to your work on context. Prepare to discuss it Wednesday
https://ticas.org/sites/default/files/pub_files/classof2016.pdf
#2: By 11:59 p.m. Tuesday, fix the issues with your charts and stories from Assignment #2. Post on WordPress, use the Context category for a tag
Ehrenreich Response 1/24 – Andrew Epperson
Barbara Ehrenreich’s style of immersion journalism concerning the poor working class sheds light on what life is truly like for people who cannot or can hardly afford the simple necessities that allow someone to live in America. In order to truly understand what these people go through, the author sets out to live the life of a struggling working-class woman.
Because she decided to give herself a certain number of resources initially, her first month’s rent was already paid for. She opted to live in a place that was farther away from the hub of Key West where she looked for work, so her rent was cheaper than what she would have paid in the town. This still proved to be a nuisance for her daily traveling, and by the end of her first month, she did not have the money needed to pay for another month’s rent.
In looking for jobs, Ehrenreich was initially picky: no waitressing or clerking. Still, she eventually got a job as a waitress at a hotel and began making less money than she would have in other capacities. She made just over $5 an hour and had to deal with the fact that her salary was just over $2.40 an hour plus tips. As stated before, the amount of money she ended up making didn’t add up for rent.
Ehrenreich’s food situation was murky at best. The author’s lunch consisted of chicken patties and canned beans, while her suppers came in the form of $2 burgers at the restaurant. She still found herself hungry at night.
Based on what is stated in the author’s work, working-class poor tend to worry about housing more than anything else. Ehrenreich’s coworkers had incredibly shady living situations – some shacked up together in a hotel, others split the rent in flophouses. Some could afford to live in a trailer, while others were living out of their cars. The moral of the story is none had favorable living situations, and many worried about where they lived at the time and plotted to move as a response. One question to ask a poverty-stricken worker is, “What is your living situation like, and do you feel comfortable in the place you’re staying now?”
In doing work for Prof. Foley’s and Prof. Carpenter’s documentary classes, my knowledge and familiarity of the homeless situation in Northwest Arkansas has increased exponentially. I am not only familiar with the poorest individuals in the area, but I know some of them as friends and have a broad understanding of their circumstances. Many of the people I will interview live in the Seven Hills housing complex in Fayetteville, where tenants pay just over $200 a month to live in temporary housing. Most were formerly homeless, so they are happy to be where they are. At the same time, they strive to improve their economic situation and standing, so they don’t plan on staying in the housing for more than a year or half a year at a time.
Questions like, “Was there anything you could have done to prevent living in this situation, and is there anything you believe you can do to get out of it?” could garner interesting responses. Or, “Do you believe officials can and should help you and why?” could shed light on how these people believe they should be treated. Many topics and future questions came to mind when reading Ehrenreich’s piece, and I truly believe it will be a resource for me as I dive into the projects associated with this data reporting class.
Blog Post 1 Katie Serrano
According to the Simplified Poverty SS, Benton had the highest median household income at $56,016, while Lee had the lowest at $25,724.
- Right off the bat, Ehrenreich has to “get in the mindset” of a worker who barely makes enough to get by, and she had to change her mindset of “feeling sorry for the parents who had paid college tuition for these blu-collar wannabes” in order to really submerge herself in this project and experience it first hand. One of the major discoveries she makes after a month or so of working in these conditions in the severity of her coworkers living situations, as well as her own after moving to Key West. One example that really puts how much this project changed her previous day-to-day life was the fact that she had to spend $30 on a pair of khakis, which she claimed to be a “setback” and searched several department stores to find the cheapest pair.
- I would start off by going to waiter and waitressing jobs, specifically locations such as Waffle House that are open late or 24 hours. I would be as respectful as possible, explain what I was doing, and start off by letting them tell me their story. I would ask about kids, what ends they are trying to meet, the types of neighborhoods they live in our their living situations. How they got to where they are, and what they see for themselves going forward.
Simplified Poverty SS Blog-AubryTucker
Making sense of the Simplified Poverty SS…
County in question: Benton,
|
Population 16 years and over
|
In labor force
|
Civilian labor force
|
Employed
|
Unemployed
|
Less than $10,000
|
$10,000 to $14,999
|
$15,000 to $24,999
|
$25,000 to $34,999
|
$35,000 to $49,999
|
$50,000 to $74,999
|
$75,000 to $99,999
|
$100,000 to $149,999
|
$150,000 to $199,999
|
$200,000 or more
|
Median household income (dollars)
|
Poverty-All families
|
Poverty- With related children of the householder under 18 years
|
Poverty-With related children of the householder under 5 years only
|
| 185684 | 0.642 | 0.641 | 0.619 | 0.022 | 0.045 | 0.041 | 0.093 | 0.096 | 0.147 | 0.202 | 0.124 | 0.144 | 0.049 | 0.058 | 59016 | 0.088 | 0.129 | 0.133 |
In Benton County there are 185,684 people of at least 16 years of age, of that number .642 are in the labor force, so 185,684(.642)=119,209 people of age to work who have jobs. Civilian Labor force is nearly the same portion. I can use this formula for the remaining decimals or translate it by using percentages, by moving the decimal to understand the portion of the community pertaining to each category. After considering these numbers and how they relate to the county’s population I think it’s best to look at what categories I think are the most interesting. I think the most news worth categories are the final three,
American Community Survey Data 1/23/2018
The data laid out in the spreadsheet lists many pieces of information involving Arkansas counties and the people who live in them. The information is separated to show statistics involving the economic situations in each county (employment, unemployment, salaries, healthcare, etc.).
The purpose of this blogpost is to use the data presented to determine the county with the highest median household income and the county with the lowest median household income.
Based on the table, the county with the highest median household income would be Benton Co. with 59,016. The county with the lowest median household income would be Lee Co. with 25,724.
In doing further research on the table, one can see that Benton Co. has a 2.2-percent unemployment rate compared to Lee Co.’s 6.7 percent. Based on that information, one can see that Benton Co. has a lower unemployment rate, meaning more citizens work and therefore have more money to spend. That observation doesn’t take into consideration those who work menial jobs with minimum wage. At the same time, Lee Co. has a higher unemployment rate, meaning fewer people have jobs and, therefore, not as much money in their households.
Ann Claire Johnson Homework 1.23.18 -Updated
Ann Claire Johnson
Advanced Reporting and Data Analysis
Blog Post 1.23.18
1) Nickel & Dimed: Ehrenreich provides a roadmap for how to write about the working poor. I want you to describe some of the issues she has to confront as she moves into this new life – housing, transportation, food and so forth.
On page 38 of Nickel & Dimed, Ehrenreich talks about her decision to move closer to Key West. “First, because of the drive. Second and third, also because of the drive: gas is eating up $4-$5 a day, and although Jerry’s is as high-volume as you can get, the tips average only 10 percent, and not just for a newbie like me. Between the base pay of $2.15 an hour and the obligation to share tips with the busboys and dishwashers, we’re averaging only about $7.50 an hour.” Throughout the entire Introduction and chapter 1 she makes note of every dollar she spends and makes. This helps her audience gain insight into what it is like being classified as a working, poor person.
2) Based on this reading, begin to develop questions for interview subjects about their experience in the low-wage labor force. Include ideas of where you would go and contact people for our stories.
- One question I would ask is, when do they make the decision to sacrifice one necessity or want for another?
- How much does the order of your necessities change by priority when you have children or a significant other?
- What are the little things that you save on or sacrifice that make a difference for your every day budget?
- Is it hard to refrain from treating yourself or do you just block out the option of ever living out of your means?
- If you had all the money in the world, what would be the first thing you spent it on?
Benton had the highest median household income at $59,016 and Lee county had the lowest with $25,724.
Trial Post
Professor Wells is awesome!! I hope this post works
-Ann Claire Johnson
Winters-Post
Hi! 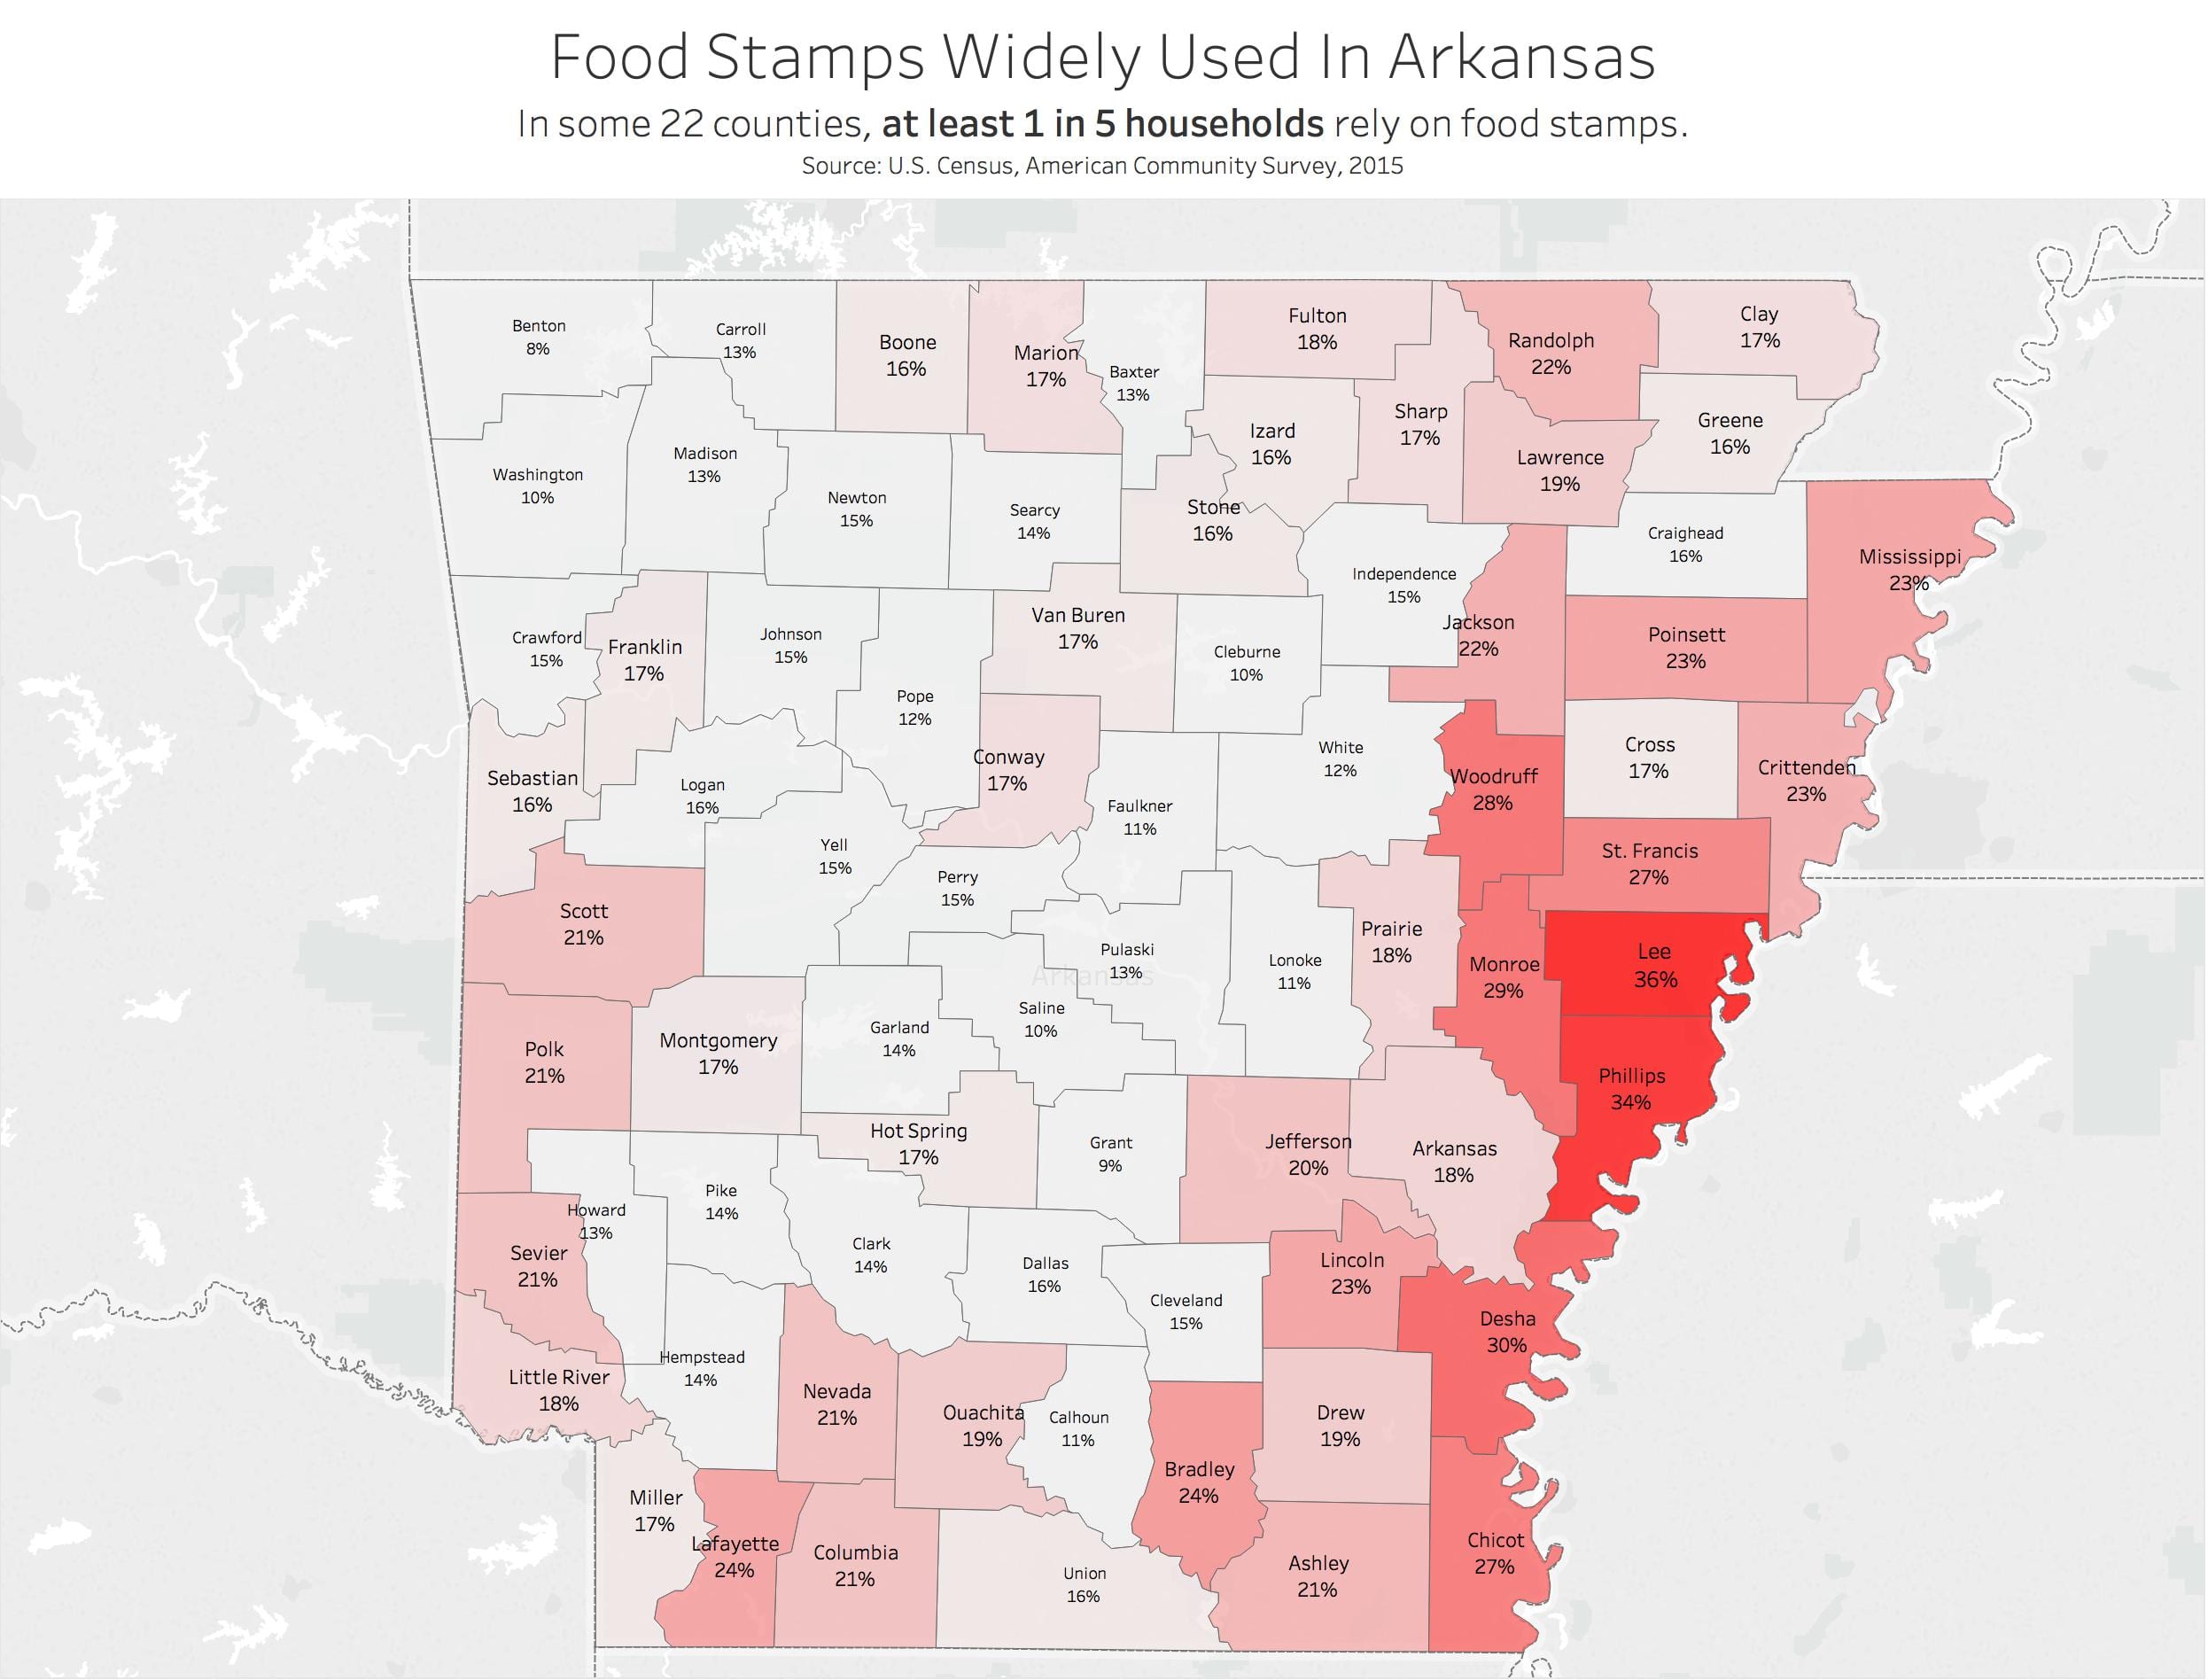
Butler-Post
hello hello!
Bourke-post

howdy
Tucker-post
SHEP-w9a1z7 hello!