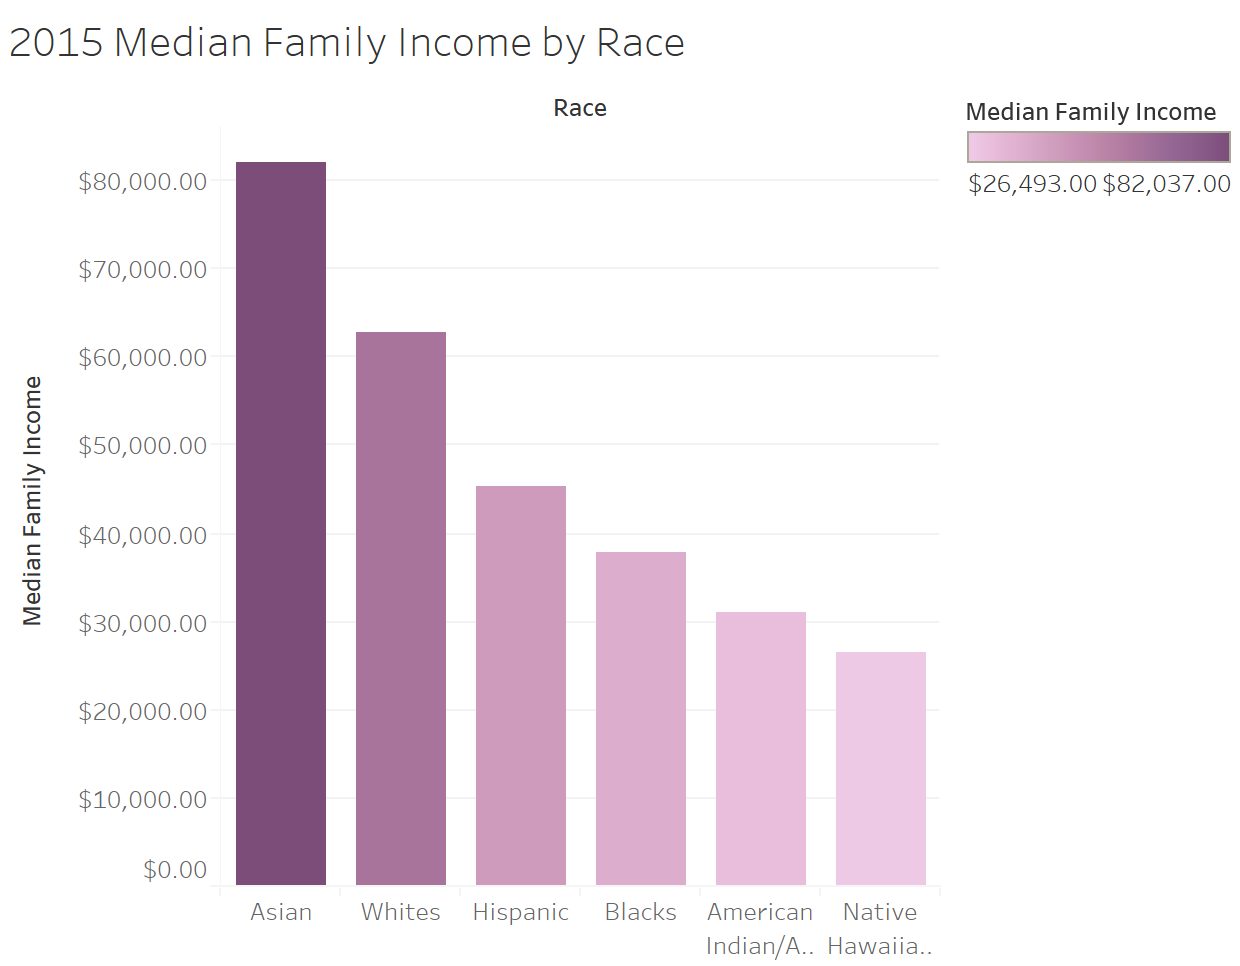
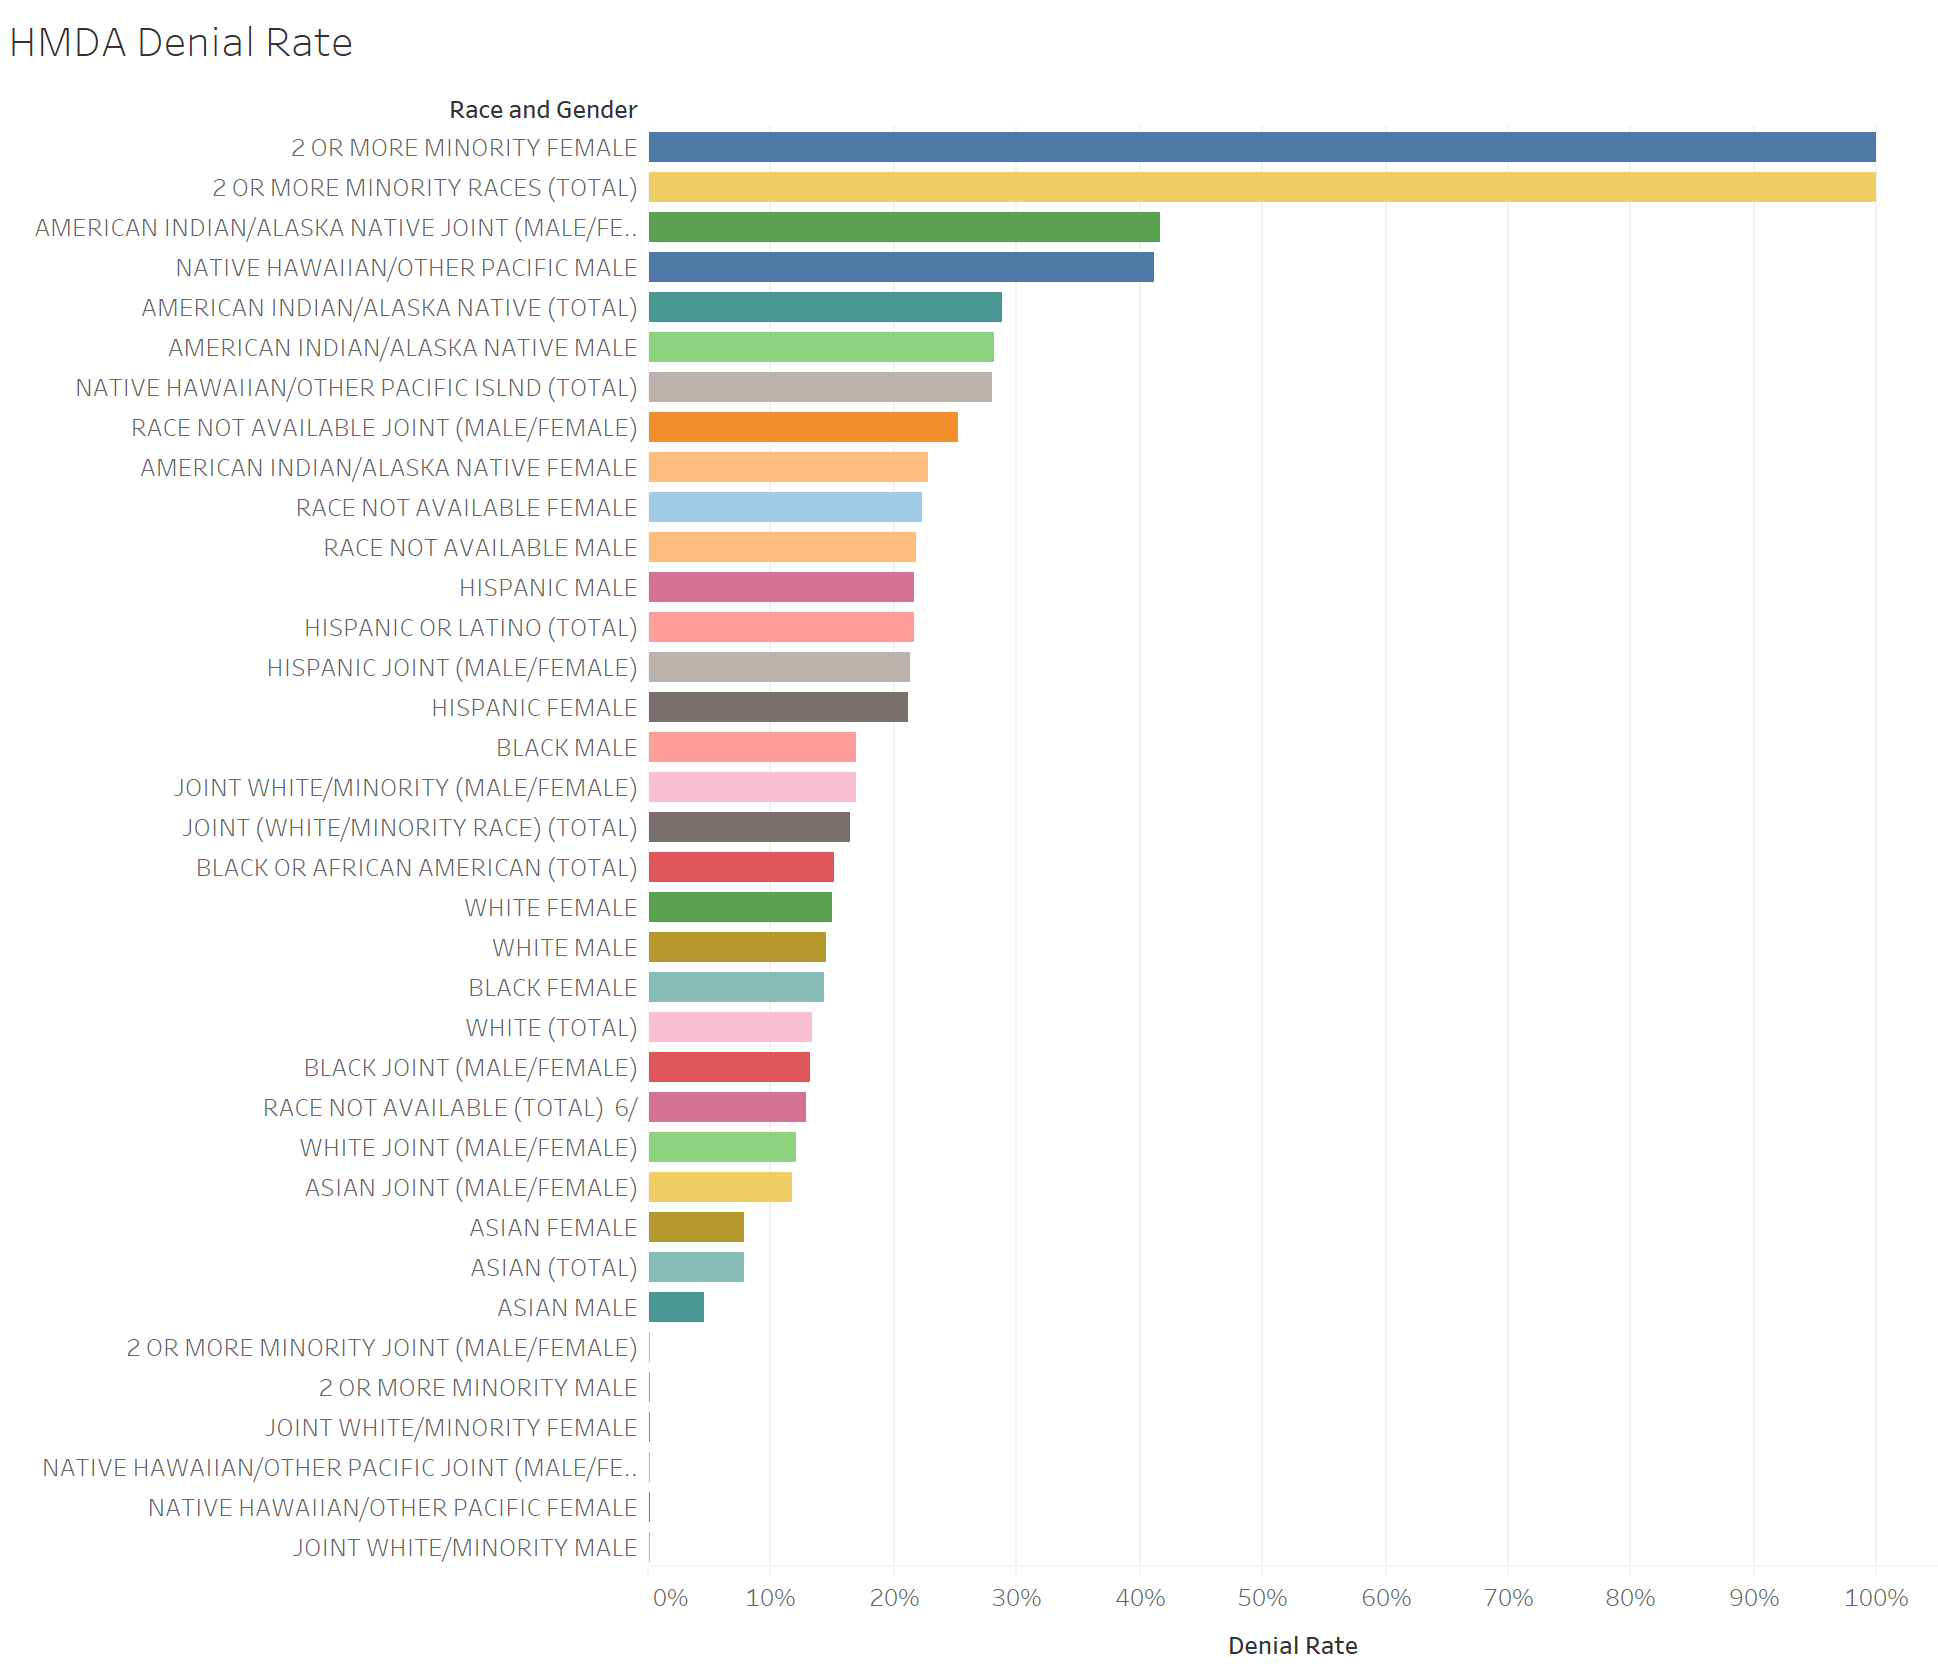
When looked at by race, those races that have a higher median family income appear to be denied home mortgage loan applications at a much lower rate than those races who have a lower median family income. This data indicates that Asians – who had the highest median family income in 2015 – were denied home loans the fewest amount of times, compared to other races. Additionally, those who identified as American Indian/Alaskan Natives and Native Hawaiian/Pacific Islander had the lowest median family incomes in 2015 and were denied loans at the highest rate.
Categories
- Census
- Class Documents
- Class_Assignments
- Class_SP_2018_Assignments
- Context
- Daily-Class
- Drafts
- Excel
- Fall 2016 Daily-Class
- Fall 2016 Student Work
- Fall 2016 Uncategorized
- Fall 2017
- Fall2018_class
- Graded
- Independent Study
- J2013
- Map
- R Studio
- Schleuss
- Spring_2017
- Spring2019_Class
- SQL
- Student Work-SPRING18
- Student_Work
- Tableau
Archives
- January 2019
- December 2018
- November 2018
- October 2018
- September 2018
- August 2018
- May 2018
- April 2018
- March 2018
- February 2018
- January 2018
- December 2017
- November 2017
- October 2017
- September 2017
- August 2017
- May 2017
- April 2017
- March 2017
- February 2017
- January 2017
- December 2016
- November 2016
- October 2016
- September 2016
- August 2016
Recent Posts
Recent Comments
- rswells on Kris Smith – Student Loan Debt Race/HBCUs
- rswells on Halie Brown – Final, Historically Black College and University Student Loan Debt
- rswells on OVERVIEW – Katie Beth Nichols
- rswells on OVERVIEW for Student Loan Debt Project – Haley Ruiz 11/25
- rswells on Van Dyke FEMALE-line,static,top10,bottom10
These charts are very nice and well-formatted. They don’t exactly align, which is something we will address when we return to Tableau. Basically, line up a second rejection rate chart by race as you did with income on top. But quality work here in any event.
On the title of the top chart, remember to describe the Northwest Arkansas MSA for the area.