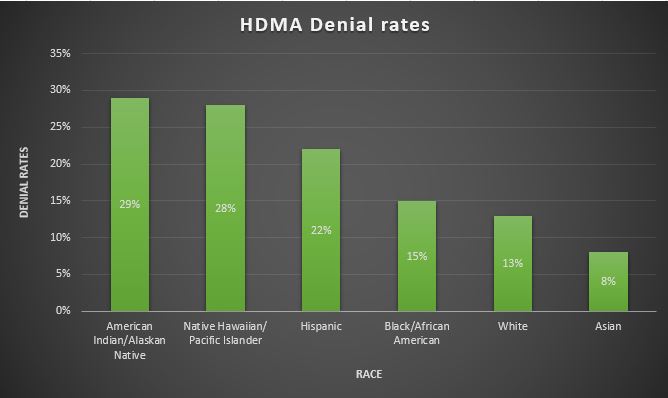
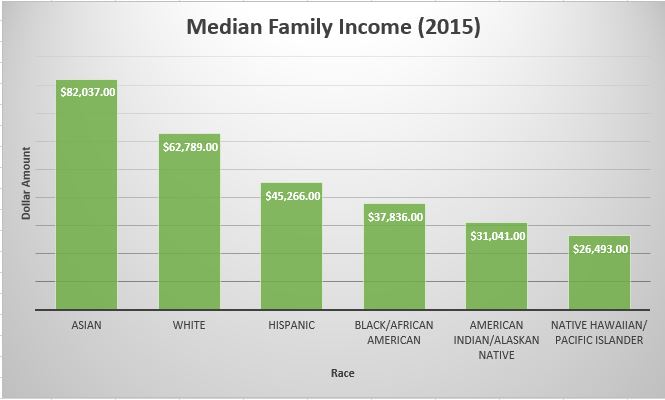
The information presented demonstrates that the Asian population had the lowest rejection rate and highest median family income.
Native Hawaiian/ Pacific Islander residents of NWA had the highest rejection rate when applying for a home loan and the lowest median family income in 2015.
When observing the fact that the Black/African American community had a lower median family income than Hispanics and still had a lower rejection rate, a discrepancy between wealth and different races is suggested according to the HDMA and Census data.
Really a nice job formatting these charts and analyzing the trends. I would line up the racial categories to make the comparisons more evident on first glance. But this is quality work.