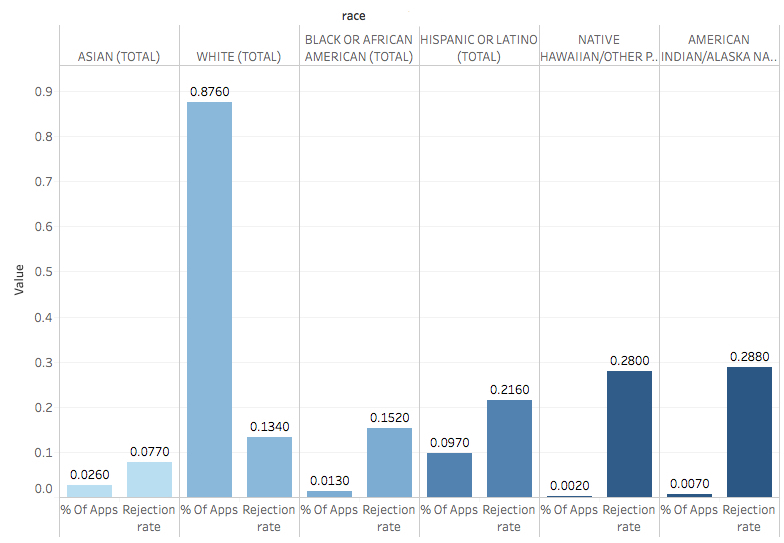
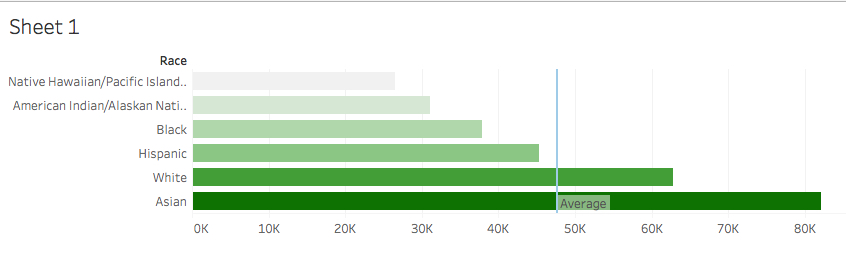
I had some issues with loading both data sets to compare graphs, but can still do so with theses two separate graphs. If you look at the new demographic data with income by race, Asians by far have the highest income, being 30K more than the average and nearly 20K more than the second-most-earning race, whites. When looking at this next to the rejection rate for mortgages and the application rates, we see that Asians have the smallest rejection rate. It appears that income and rejection rate of home mortgage loans have an inverse relationship when comparing them by race. This will be important to consider moving forward, and we should look more into the size of the mortgage loans and what impact income explicitly has on one’s ability to get a mortgage loan.
Please note that the rejection rate graph is in percent of the population. Whites are listed as 0.88, which means 88 percent of the population. It does not seem that percent of population has a consistent correlation with income; however it is true that whites, the largest population, does earn above average income, and it is also true that two least represented races in population also are most likely to get rejected for loans and have the lowest household incomes.
This is a good start. Going forward, use AP style on numbers: “30K more than the average and nearly 20K more than the second-most-earning race, whites. ” That would be $30,000 more than the average and nearly $20,000 more…”
When we return to Tableau, I’ll describe how to properly format the percentages on the legends and data labels and how to insert titles.
This shows progress, so keep up the good work.