I was feeling purple today.
Categories
- Census
- Class Documents
- Class_Assignments
- Class_SP_2018_Assignments
- Context
- Daily-Class
- Drafts
- Excel
- Fall 2016 Daily-Class
- Fall 2016 Student Work
- Fall 2016 Uncategorized
- Fall 2017
- Fall2018_class
- Graded
- Independent Study
- J2013
- Map
- R Studio
- Schleuss
- Spring_2017
- Spring2019_Class
- SQL
- Student Work-SPRING18
- Student_Work
- Tableau
Archives
- January 2019
- December 2018
- November 2018
- October 2018
- September 2018
- August 2018
- May 2018
- April 2018
- March 2018
- February 2018
- January 2018
- December 2017
- November 2017
- October 2017
- September 2017
- August 2017
- May 2017
- April 2017
- March 2017
- February 2017
- January 2017
- December 2016
- November 2016
- October 2016
- September 2016
- August 2016
Recent Posts
Recent Comments
- rswells on Kris Smith – Student Loan Debt Race/HBCUs
- rswells on Halie Brown – Final, Historically Black College and University Student Loan Debt
- rswells on OVERVIEW – Katie Beth Nichols
- rswells on OVERVIEW for Student Loan Debt Project – Haley Ruiz 11/25
- rswells on Van Dyke FEMALE-line,static,top10,bottom10


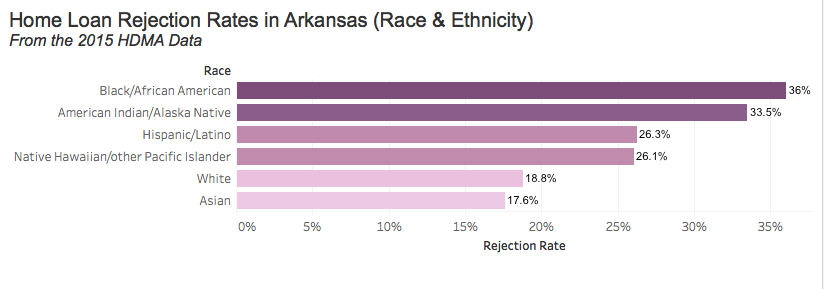
ASHTON – Good charts. The math is off on the state data since you calculated the “loans purchased by institution” as part of the Arkansas total. Removing that, you get:
Black- 3400 38.37%
Am Indian 300 35.21%
Nat. Haw. 52 27.66%
White 15894 20.50%
Asian 253 18.67%
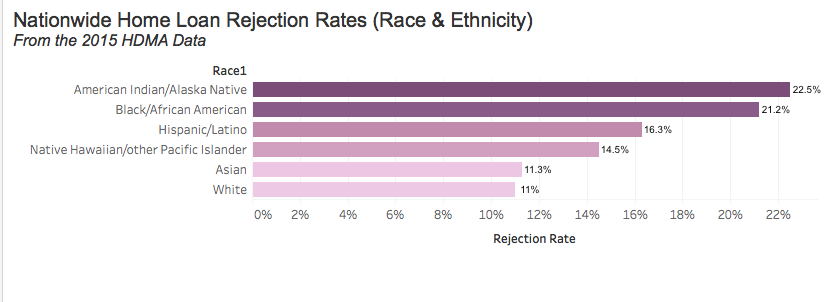
The national data is correct. Thanks very much