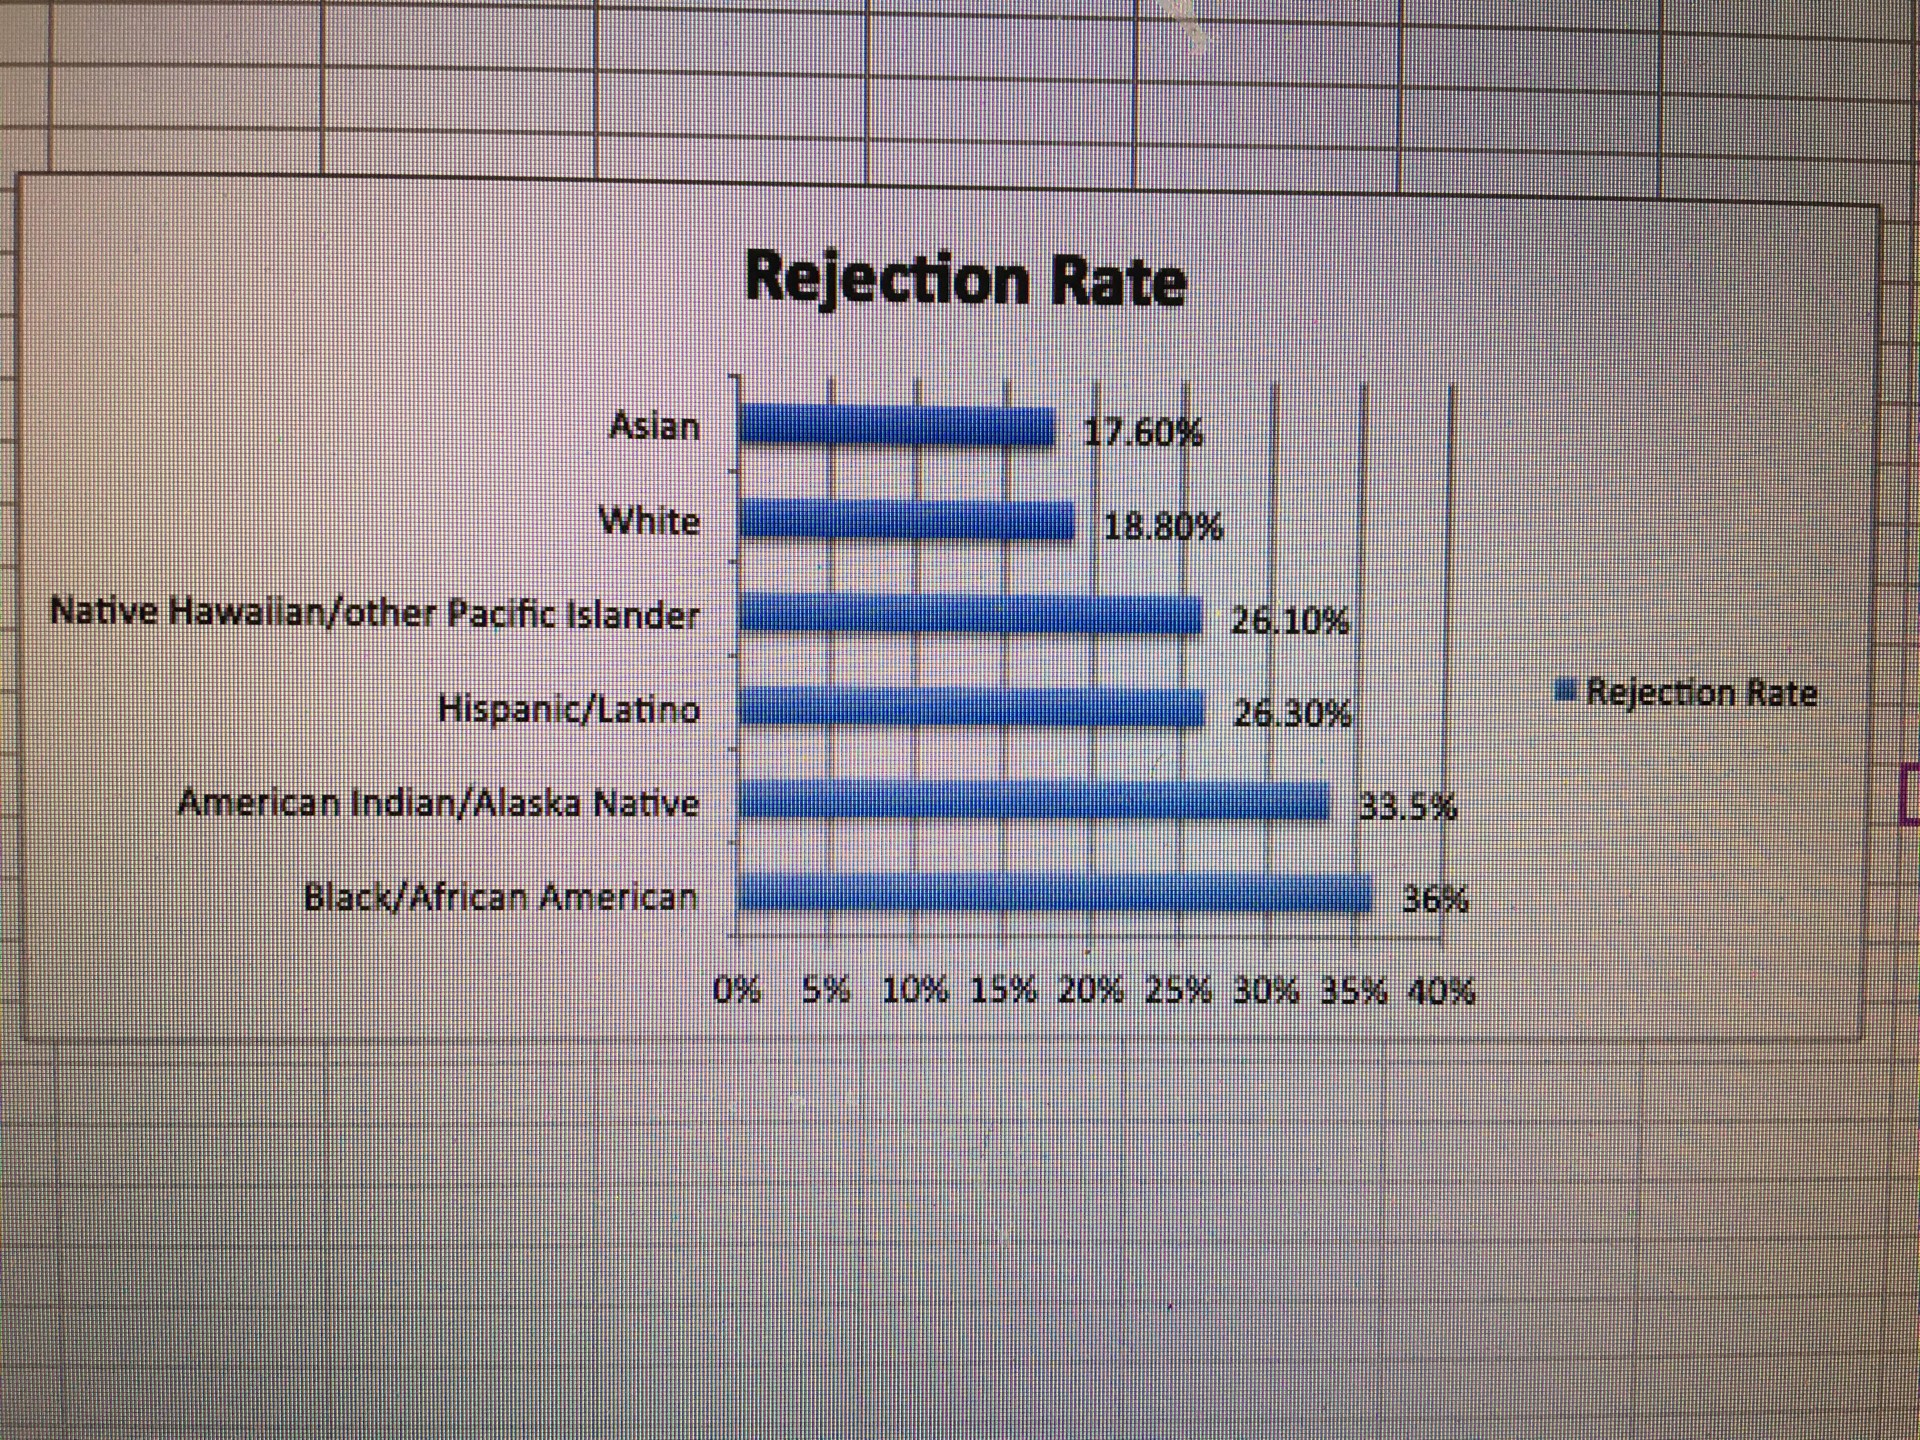
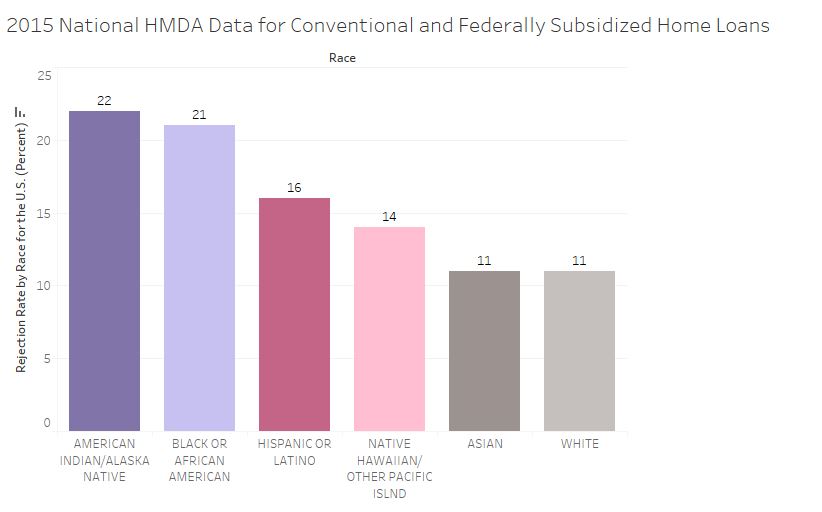
I worked on the National Rejection Rate. Chandler Lyster worked on Arkansas Rejection Rate 
Categories
- Census
- Class Documents
- Class_Assignments
- Class_SP_2018_Assignments
- Context
- Daily-Class
- Drafts
- Excel
- Fall 2016 Daily-Class
- Fall 2016 Student Work
- Fall 2016 Uncategorized
- Fall 2017
- Fall2018_class
- Graded
- Independent Study
- J2013
- Map
- R Studio
- Schleuss
- Spring_2017
- Spring2019_Class
- SQL
- Student Work-SPRING18
- Student_Work
- Tableau
Archives
- January 2019
- December 2018
- November 2018
- October 2018
- September 2018
- August 2018
- May 2018
- April 2018
- March 2018
- February 2018
- January 2018
- December 2017
- November 2017
- October 2017
- September 2017
- August 2017
- May 2017
- April 2017
- March 2017
- February 2017
- January 2017
- December 2016
- November 2016
- October 2016
- September 2016
- August 2016
Recent Posts
Recent Comments
- rswells on Kris Smith – Student Loan Debt Race/HBCUs
- rswells on Halie Brown – Final, Historically Black College and University Student Loan Debt
- rswells on OVERVIEW – Katie Beth Nichols
- rswells on OVERVIEW for Student Loan Debt Project – Haley Ruiz 11/25
- rswells on Van Dyke FEMALE-line,static,top10,bottom10

I asked for the charts in Tableau. This screen shot looks really sketchy and isn’t acceptable.
The math is off on the state data since you calculated the “loans purchased by institution” as part of the Arkansas total. Removing that, you get:
Black- 3400 38.37%
Am Indian 300 35.21%
Nat. Haw. 52 27.66%
White 15894 20.50%
Asian 253 18.67%
The national data — American Indian rejection rate was 22.5% so that should have been rounded up to 23%. Use percentage signs — % — on the columns.