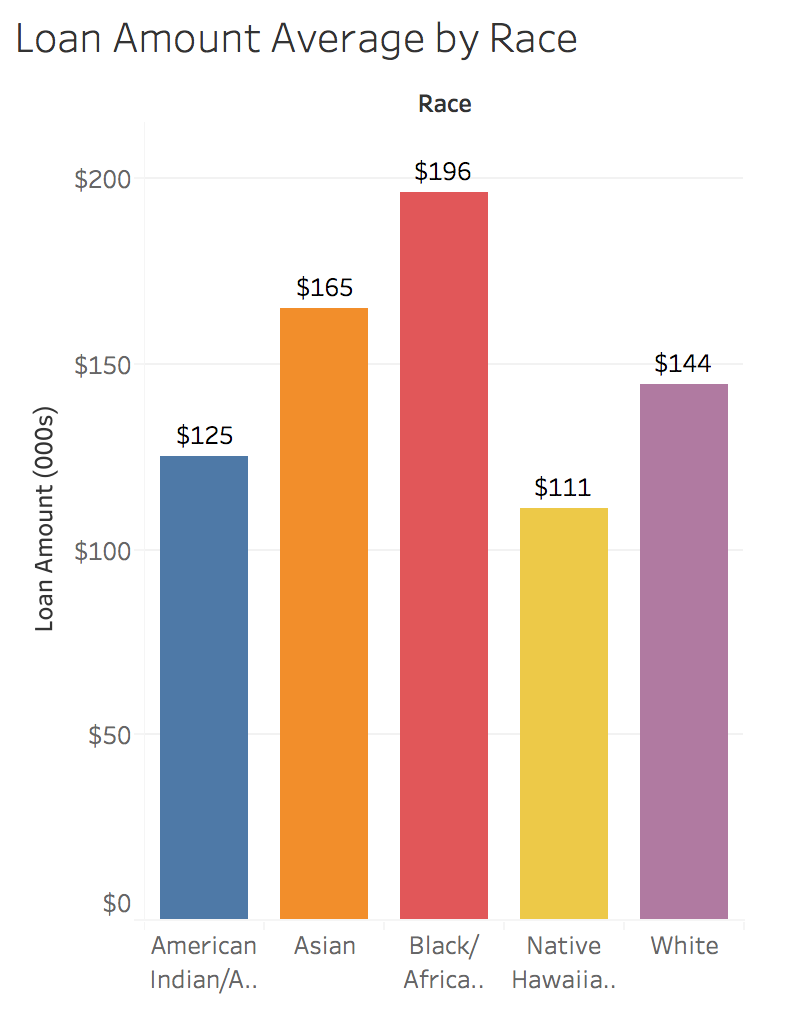
Chart: “Loan Amount Average By Race”:
Needs further change – eliminate Hispanic or latino in the legend
–Rotate the x axis labels so they are vertical. they are squished up now.
–Insert a short text box citing source of the data and date
–I want to double check your spreadsheet calculations on this too.
–Bar Labels need further revision. put in $100,000s. They look weird with $125, etc
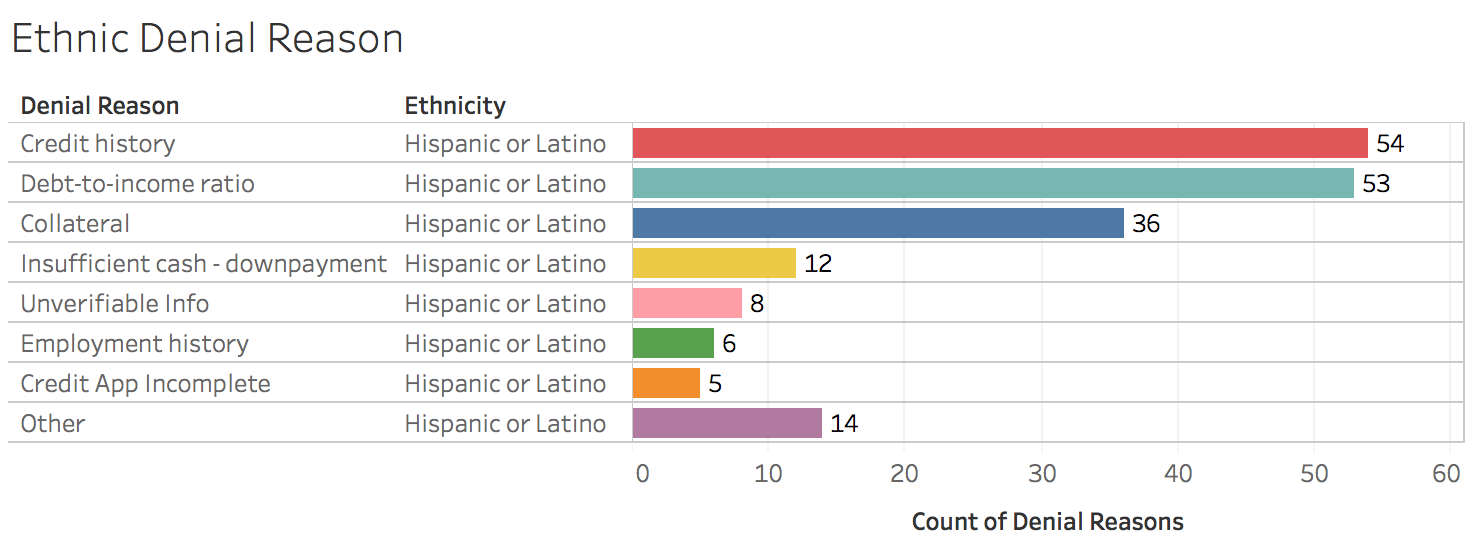
Chart: “Ethnic Denial Reason”
–Eliminate Hispanic or latino in the chart – doesn’t need to be repeated. Just put that in the title once.
–Insert a short text box citing source of the data and date
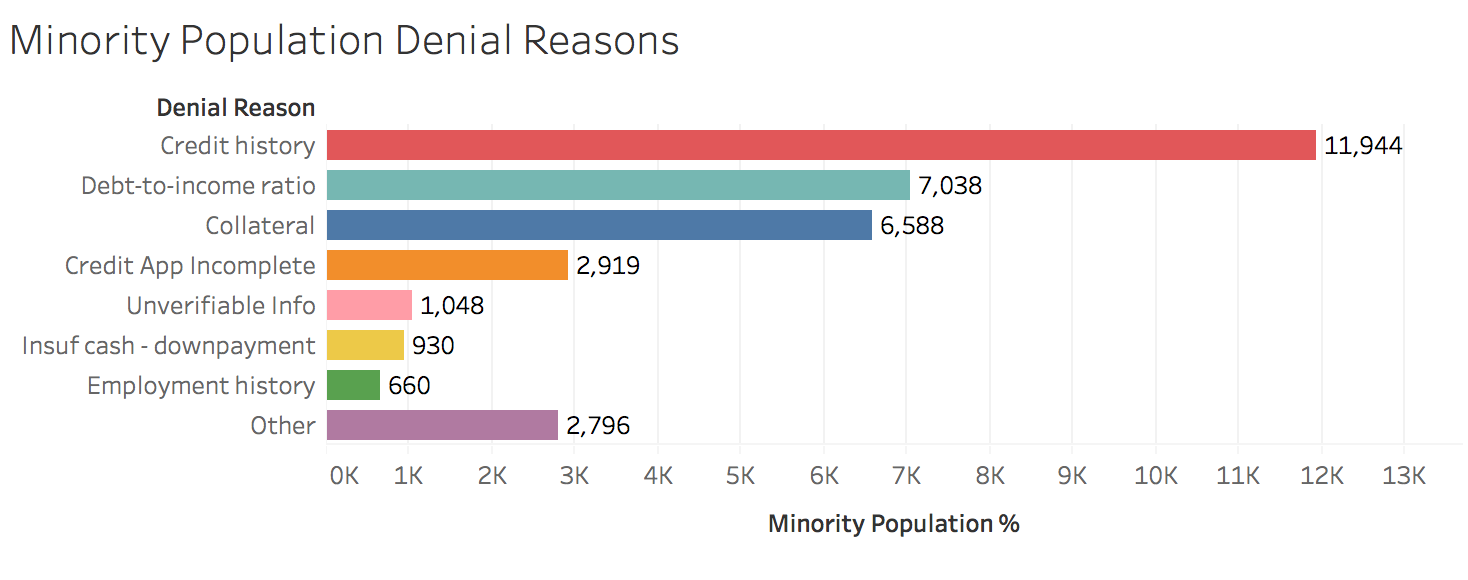
Chart: “Minority population.”
–Insert a short text box citing source of the data and date
Ok, almost there. A few more tweaks.
Chart: “Loan Amount Average By Race”:
Needs further change – eliminate Hispanic or latino in the legend
–Rotate the x axis labels so they are vertical. they are squished up now.
–Insert a short text box citing source of the data and date
–I want to double check your spreadsheet calculations on this too.
–Bar Labels need further revision. put in $100,000s. They look weird with $125, etc
Chart: “Ethnic Denial Reason”
–Eliminate Hispanic or latino in the chart – doesn’t need to be repeated. Just put that in the title once.
–Insert a short text box citing source of the data and date
Chart: “Minority population.”
–Insert a short text box citing source of the data and date