Here is my attempt at a stacked-bar chart. It isn’t how I would ideally present this data, but this combination of factors was the best one I tried. Additionally, I would have liked to figure out how to better label and scale the chart, but I couldn’t find that function even after transferring this to a “story.” So far, Tableau is not as intuitive as I thought it would be! 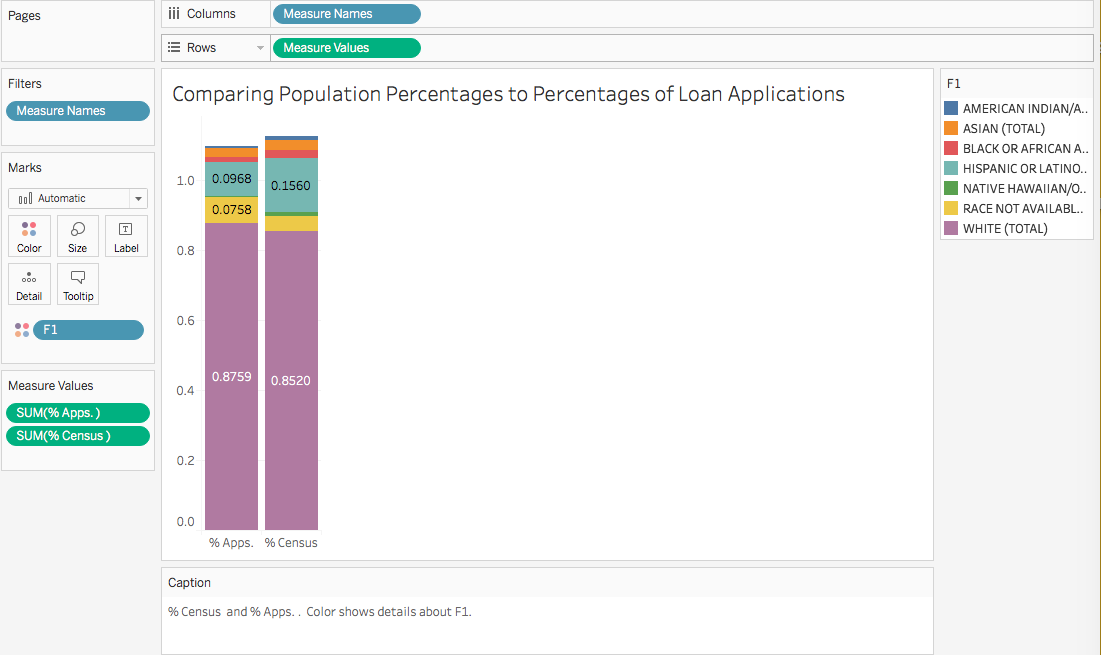
Data Journalism Backup Site
Here is my optional tagline
Recent Comments