Categories
- Census
- Class Documents
- Class_Assignments
- Class_SP_2018_Assignments
- Context
- Daily-Class
- Drafts
- Excel
- Fall 2016 Daily-Class
- Fall 2016 Student Work
- Fall 2016 Uncategorized
- Fall 2017
- Fall2018_class
- Graded
- Independent Study
- J2013
- Map
- R Studio
- Schleuss
- Spring_2017
- Spring2019_Class
- SQL
- Student Work-SPRING18
- Student_Work
- Tableau
Archives
- January 2019
- December 2018
- November 2018
- October 2018
- September 2018
- August 2018
- May 2018
- April 2018
- March 2018
- February 2018
- January 2018
- December 2017
- November 2017
- October 2017
- September 2017
- August 2017
- May 2017
- April 2017
- March 2017
- February 2017
- January 2017
- December 2016
- November 2016
- October 2016
- September 2016
- August 2016
Recent Posts
Recent Comments
- rswells on Kris Smith – Student Loan Debt Race/HBCUs
- rswells on Halie Brown – Final, Historically Black College and University Student Loan Debt
- rswells on OVERVIEW – Katie Beth Nichols
- rswells on OVERVIEW for Student Loan Debt Project – Haley Ruiz 11/25
- rswells on Van Dyke FEMALE-line,static,top10,bottom10
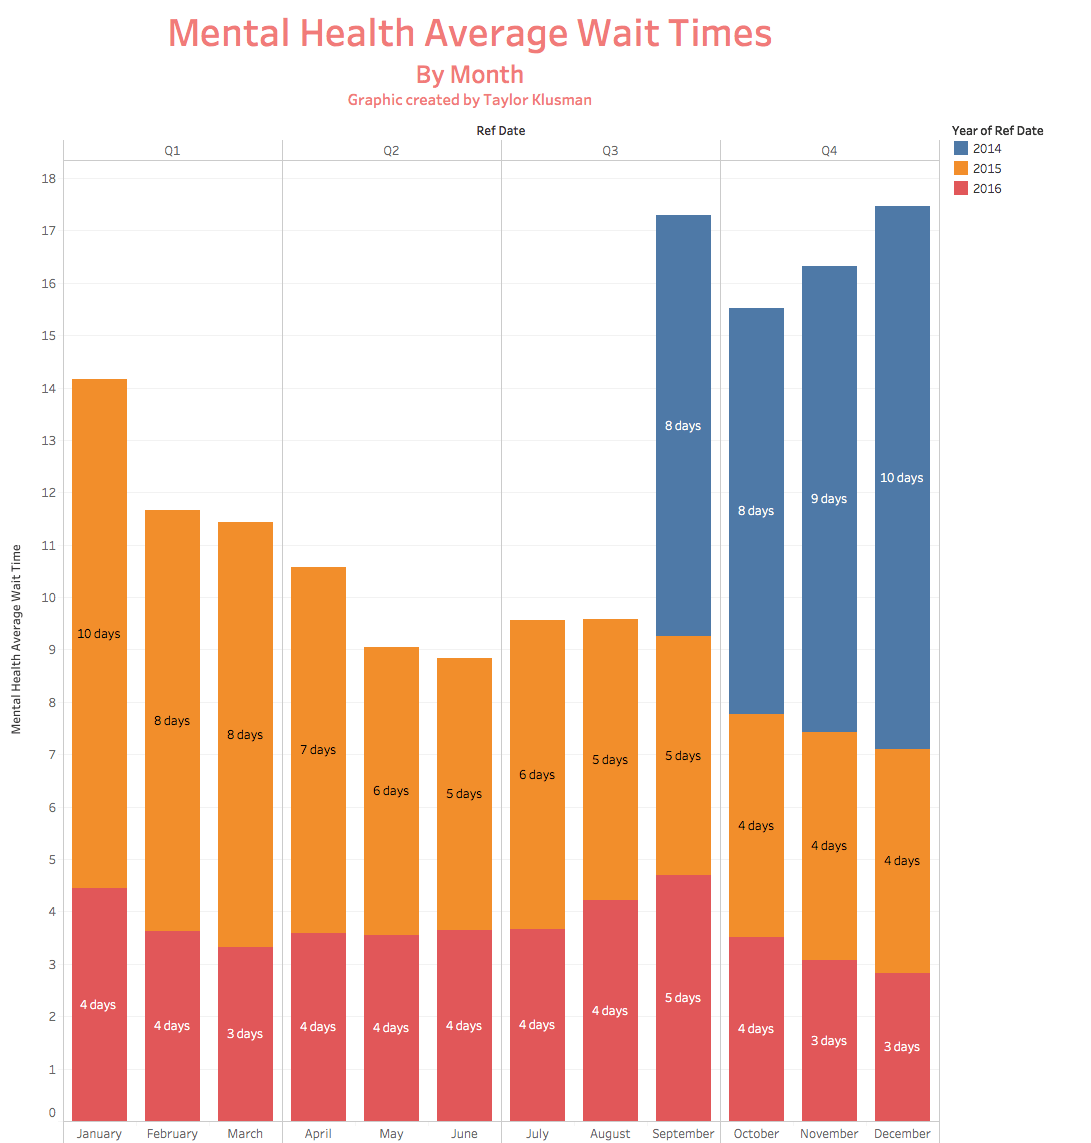
I would boost the size of this image in the blog post. I’ll review in class.
This is a cool looking graphic but it needs a few tweaks.
–Is this data for Fayetteville, Little Rock or both?
–You need to have the years broken out on the x-axis. Stacking the bars by year is really confusing.
Strong things here involve use of color and the labeling. Keep working on it. You’re getting close. 4 of 5 points.