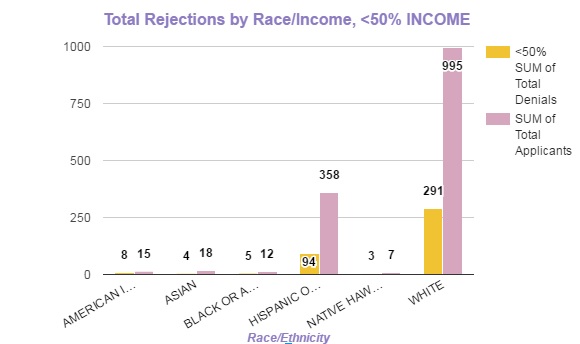
I had a bit of trouble getting Tableau to work on my computer, so after bouts of arguments with the program (even with reinstalling it and restarting my computer a few more times) I decided to make a relatively similar table using Google Sheets to represent the data and also complete the assignment the best I could.
Here’s the table:
Ok. I have Tableau installed on this classroom’s machines now, so that may help.
Comments on the interviewing game plan:
These are good questions and a decent game plan.
These questions are excellent and on point:
Are there efforts within the Marshallese community to teach other members about the process of applying for loans? Does the city help?
Is it normal in the Marshall islands to rent houses or do most people own their property?
I would avoid these credit score questions. We have no independent way of verifying the credit scores or checking into that data.
How do the credit scores of each race effect the denial rate? Those with nearly perfect scores are most likely to be approved for a loan. (that is how the process works – the better the score, the easier the approval)
If we only compared denial rates of those in each race with equal credit scores, how would that affect the data? (Great question but we won’t be able to get the credit score data so it is not worth pursuing)